Multi-Asset Performance [Spaghetti] - By Leviathan
A multi-asset performance indicator that tracks percentage changes across 30 symbols, offering comprehensive insights into asset performance, correlation, and market dynamics.
Explore 11,183 indicators. Filter beyond the obvious.
Discover the tools that fit the way you trade.
11,183 tools to explore
A multi-asset performance indicator that tracks percentage changes across 30 symbols, offering comprehensive insights into asset performance, correlation, and market dynamics.
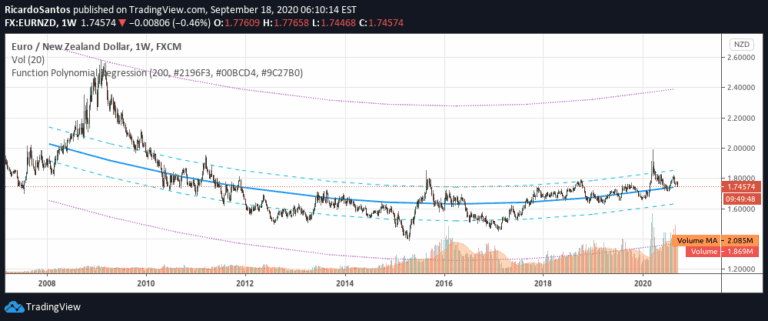
A polynomial regression function that analyzes data points to provide predictions, deviations, and statistical insights about trend and momentum patterns in financial datasets.
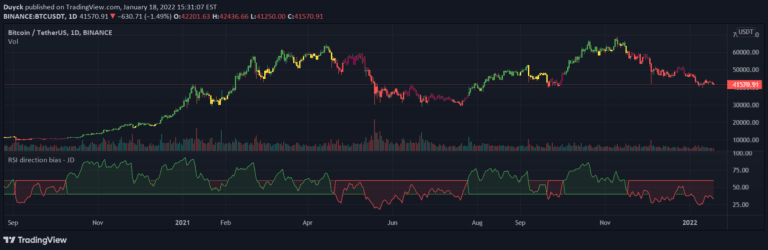
A simple market bias indicator designed to help traders filter potential trades, identify market direction, and discover potential entry points during pullbacks with minimal complexity.
A polynomial regression indicator that calculates complex curve-fitting relationships between price variables, enabling advanced trend analysis and least squares moving average (LSMA) generation.
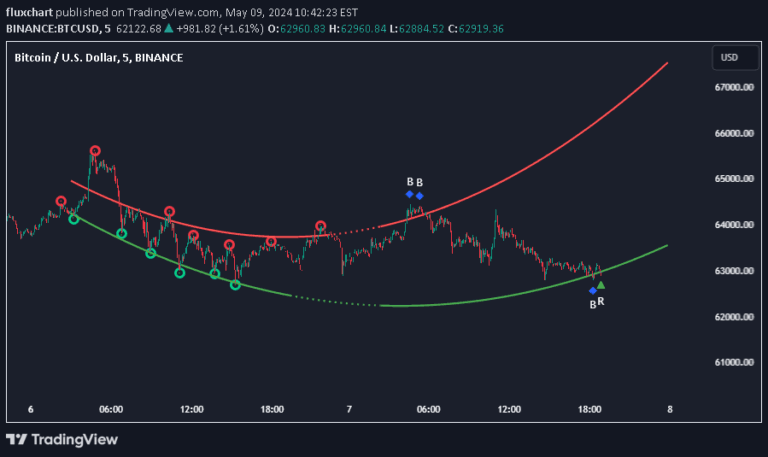
A dynamic support and resistance indicator using polynomial regression to identify price pivot points and potential trend reversal zones with customizable complexity.
A custom Tradingview indicator designed to display chart information cleanly while providing a personalized watermark for traders seeking discipline and self-mastery.
Pivot points are unique pattern recognition techniques for identifying market structure through sequential high and low formations across different bar configurations and complexity levels.
A volume profile indicator that analyzes volume distribution across price levels by breaking down price ranges into grids and proportionally attributing volume from lower timeframes.
A unique Bollinger Band variant built on zigzag pivots, providing a comprehensive view of price movement relative to historical trend and volatility ranges.
Trendline Scythes is an advanced charting tool that creates curved trendlines based on price pivots and market volatility, offering unique insights into trend dynamics and potential breakouts.
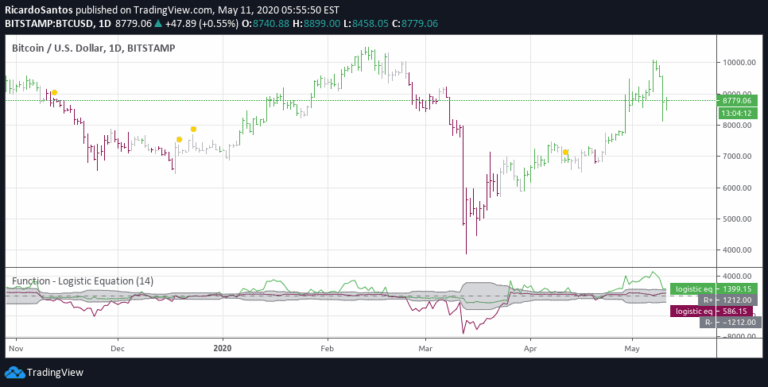
An experimental trading approach exploring the logistic equation's potential correlation with market dynamics, suggesting mathematical patterns might predict or explain market behavior.
A dynamic RSI indicator that incorporates sentiment and volume analysis to provide enhanced momentum insights and potential market reversal signals.
Likes, views, and comments are historical TradingView snapshots. They describe attention, not trading performance.