Uhl MA Crossover System
The Corrected Moving Average (CMA) is an adaptive moving average system designed to minimize false signals in sideways markets and provide more accurate trend identification across different market conditions.
Explore 11,183 indicators. Filter beyond the obvious.
Discover the tools that fit the way you trade.
11,183 tools to explore
The Corrected Moving Average (CMA) is an adaptive moving average system designed to minimize false signals in sideways markets and provide more accurate trend identification across different market conditions.
EMA-Deviation-Corrected T3 is an advanced moving average that uses EMA deviation to smooth price data and generate more precise trading signals with reduced noise.
Advanced statistical indicator calculating annualized standard deviation and price movement probabilities to provide traders with quantitative market insights and dynamic trading alerts.
A technical analysis tool that identifies candles with volume exceeding the previous one by 10 times, helping traders spot potential trend reversals or continuations.
A trading script that identifies market trends using EMA calculations, color-codes candlesticks, and highlights potential liquidity zones through dynamic pivot level tracking.
A dynamic price level indicator that generates horizontal support and resistance lines based on a starting price and adjustable range sizes for trading analysis.
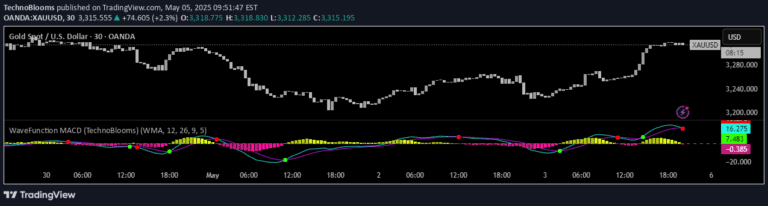
WaveFunction MACD is an advanced momentum indicator combining classical MACD logic with wave physics and quantum mechanics principles to analyze market energy and trend dynamics.
A scaled ATR range indicator that analyzes historical price data, adjusting for inflation and market conditions to provide insights into potential price ranges and market behavior.
A refined version of the MACD indicator using Zero-Lag Exponential Moving Averages to reduce signal delay and improve trend detection responsiveness in market analysis.
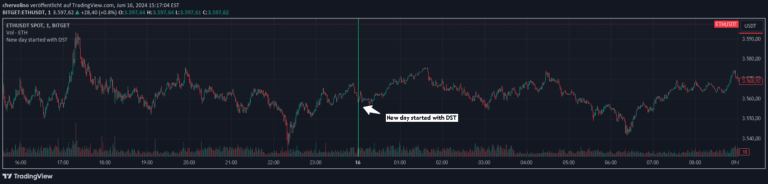
A precise time-based indicator that highlights the first trading bar of each day in the German market, accounting for timezone and daylight saving time adjustments.
An inflation-adjusted chart revealing the true purchasing power of an asset by comparing nominal price against inflation-corrected value over time.
The Triple Exponential Moving Average (TEMA) is an advanced technical indicator that reduces lag in moving averages, providing faster and more responsive trend signals across multiple timeframes.
Likes, views, and comments are historical TradingView snapshots. They describe attention, not trading performance.