
YOUR INDICATOR RESEARCH STARTS HERE

Find the right indicator.
Understand what it does.

Explore 11,183 indicators. Filter beyond the obvious.
Discover the tools that fit the way you trade.

THE INDICATOR LIBRARY

Results for “covariance”

11,183 tools to explore

16 indicators matching your filters
Save search
VolumeTrendEditor’s pick

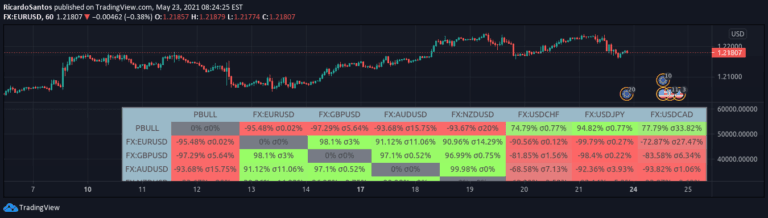
Correlation Matrix Heatmap

by RicardoSantos

A Correlation Matrix utilizes statistical tables to analyze relationships between different financial variables, helping traders understand interconnected market behaviors and potential predictive patterns.

Separate pane · unverifiedSwing Trading
Explore
854likes31.4Kviews13comments
Save
TrendMomentumEditor’s pick

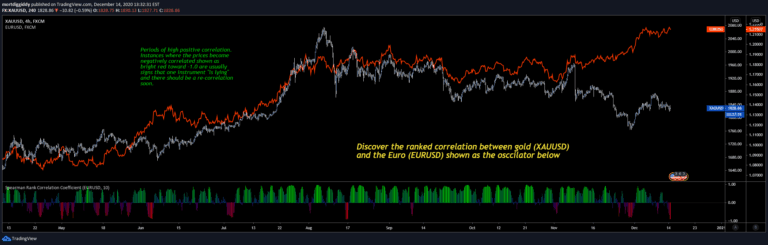
Spearman Rank Correlation Coefficient

by mortdiggiddy

Spearman rank correlation coefficient measures the relationship between two variables by analyzing how they increase or decrease together, revealing potential market synchronization patterns.

Separate pane · unverifiedSwing Trading
Explore
619likes17.1Kviews28comments
Save
TrendEditor’s pick

Correlation [array's]

by fikira

A custom script for analyzing correlations between financial instruments using advanced array manipulation techniques and statistical methods to assess relationships and potential trading opportunities.

Separate pane · unverifiedDay Trading · Swing Trading
Explore
432likes16.3Kviews19comments
Save
OscillatorSignalVolatility

Value at Risk [OmegaTools]

by OmegaTools

A Value at Risk (VaR) indicator that quantifies potential portfolio losses and classifies market risk into Risk On, Risk Off, and Risk Neutral phases using multiple statistical models.

Separate pane · unverifiedScalping · Day Trading
Explore
104likes2Kviews3comments
Save
SignalTrend

Correlation Coefficient Master Table

by DeVrizii

A comprehensive tool calculating correlation coefficients between a base asset and multiple other assets across different time periods to analyze market relationships and asset interdependencies.

Separate pane · unverifiedDay Trading · Swing Trading
Explore
71likes2Kviews0comments
Save
TrendSignal

TTP Pair Slope/Hedge

by TheTradingParrot

A pair slope/hedge technique using linear regression to calculate the relationship between two assets, helping identify potential cointegration and trading opportunities.

Separate pane · unverifiedDay Trading · Swing Trading
Explore
57likes2.5Kviews6comments
Save
SignalTrend

Correlation Analysis

by LucasVivien

A market correlation analysis tool that helps traders understand relationships between different markets by calculating and visualizing correlation coefficients across multiple financial instruments.

Separate pane · unverifiedScalping · Day Trading
Explore
54likes2.1Kviews2comments
Save
SignalTrend

Smoothing R-Squared Comparison

by simwai

A comparative analysis of smoothing techniques using R-squared values to evaluate different price smoothing algorithms and their effectiveness in identifying market trends.

Separate pane · unverifiedDay Trading · Swing Trading
Explore
45likes2.4Kviews1comments
Save

Likes, views, and comments are historical TradingView snapshots. They describe attention, not trading performance.

START WITH A QUESTION

A little less searching.
A lot more understanding.

Tell DeepAlpha what you need. Get an explanation, a shortlist,
and a direct path to the indicators behind it.

Ask DeepAlpha