Trading ABC
An advanced pattern recognition indicator that identifies ABC chart patterns using trend cloud, ZigZag, and Fibonacci levels to detect potential trading opportunities with customizable settings.
Explore 11,183 indicators. Filter beyond the obvious.
Discover the tools that fit the way you trade.
11,183 tools to explore
An advanced pattern recognition indicator that identifies ABC chart patterns using trend cloud, ZigZag, and Fibonacci levels to detect potential trading opportunities with customizable settings.
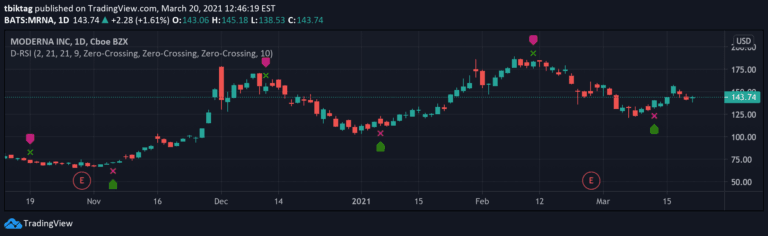
Delta-RSI Oscillator is a momentum indicator that measures the rate of change in RSI through a smoothed time derivative, providing dynamic insights into market momentum shifts.
Periodic Linear Regressions (PLR) calculates linear trend lines over customizable periods, helping traders identify underlying price trends and potential support/resistance zones.
A trading signal that finds the most similar historical price sequences and projects future price movements using multiple similarity and correlation measures.
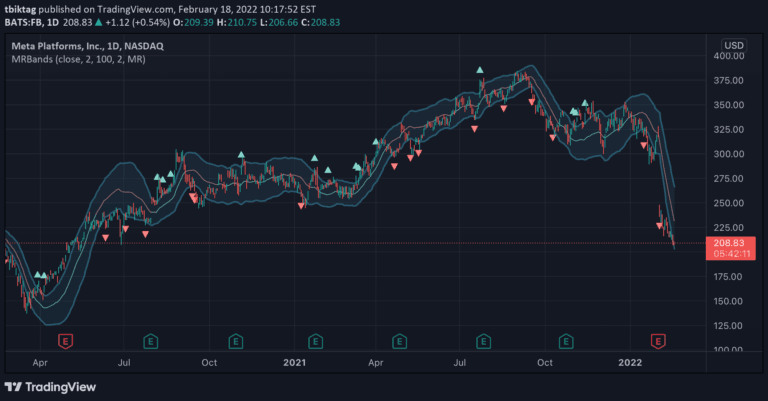
Moving Regression Prediction Bands combine regression analysis and statistical prediction to create a dynamic price prediction channel with upper and lower bands indicating potential price momentum and trend shifts.
A dynamic trend indicator that fits regression lines at different intervals, revealing market trends and potential price channels by calculating linear trends across specified timeframes.
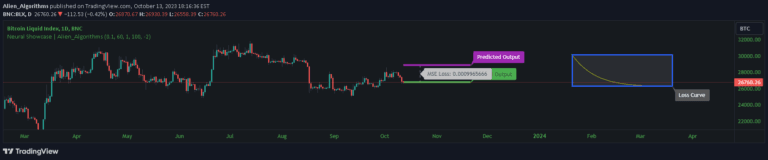
A neural network trading signal that generates price predictions using a single hidden layer with two neurons, demonstrating machine learning principles in technical analysis.
The Corrected Moving Average (CMA) is an adaptive moving average system designed to minimize false signals in sideways markets and provide more accurate trend identification across different market conditions.
An advanced trend-following indicator using Kalman Filter technology to dynamically track market trends, adapting to changing conditions through sophisticated statistical algorithms.
A trading script that calculates and tracks liquidity levels through price raids and sweeps, helping traders identify potential market reactions and reversals based on liquidity insights.
A custom logging utility for Pine Script traders to track and debug complex trading indicators by storing messages with timestamps and types for easier code development and analysis.
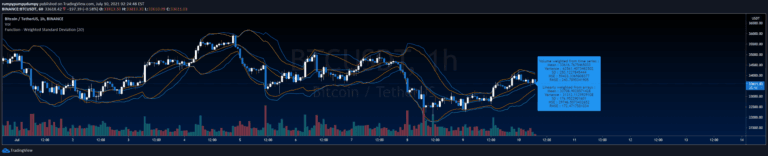
A statistical analysis function that calculates weighted mean, variance, standard deviation, and error metrics for time series data, helping traders understand data distribution and variability.
Likes, views, and comments are historical TradingView snapshots. They describe attention, not trading performance.