Anti-Volume Stop Loss
An advanced stop-loss strategy that uses volume, price, and volatility to dynamically adjust stop-loss levels, helping traders manage risk by considering individual security characteristics.
Explore 11,183 indicators. Filter beyond the obvious.
Discover the tools that fit the way you trade.
11,183 tools to explore
An advanced stop-loss strategy that uses volume, price, and volatility to dynamically adjust stop-loss levels, helping traders manage risk by considering individual security characteristics.
A custom zone indicator that identifies support and resistance levels based on previous day's and week's high and low prices, useful for trend reversals and breakout trading.
An EMA 9/21 crossover indicator that uses Average True Range (ATR) to calculate potential price targets based on EMA crossovers and market sentiment.
A Pine Script tool for calculating Compound Annual Growth Rate (CAGR) by interactively selecting two time points on a chart, providing an annualized performance metric.
A novel Relative Strength indicator that compares an asset's performance against market indices like S&P 500, Dow Jones, and NASDAQ to provide comparative market insights.
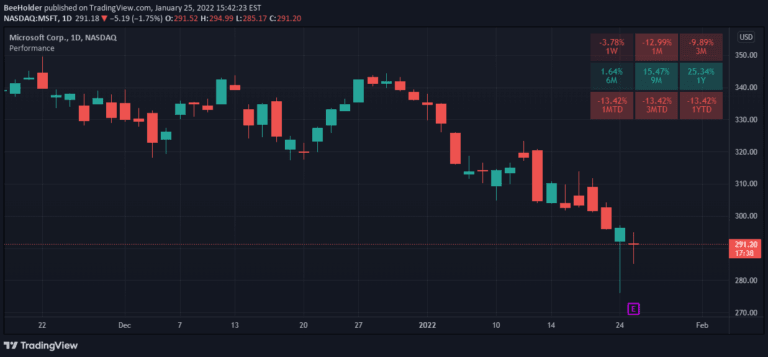
A performance indicator that compares current price to past prices, calculating returns over different time periods like 1 week, 1 month, and 1 year to track symbol performance.
A technical indicator defining an intraday noise area based on historical price movements, identifying potential significant price imbalances and trend initiation points.
A real-time price converter tool that maps corresponding price levels across multiple linked market instruments like QQQ, NDX, and NQ for enhanced trading insights.
A cross-correlation script that analyzes lead-lag relationships between multiple financial assets by calculating normalized correlation values across different time lags.
A multi-symbol momentum divergence detector that identifies potential market reversal points by comparing Directional Movement Index (DMI) values across different assets.
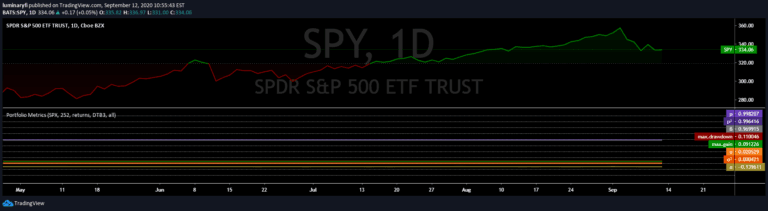
Portfolio metrics provide comprehensive insights into investment performance, analyzing returns, risk, and statistical measures to evaluate portfolio health and potential investment strategies.
A trading signal that generates buy and sell alerts based on price movements relative to VWAP and custom volume thresholds, helping traders identify potential entry and exit points.
Likes, views, and comments are historical TradingView snapshots. They describe attention, not trading performance.