RSI cyclic smoothed v2
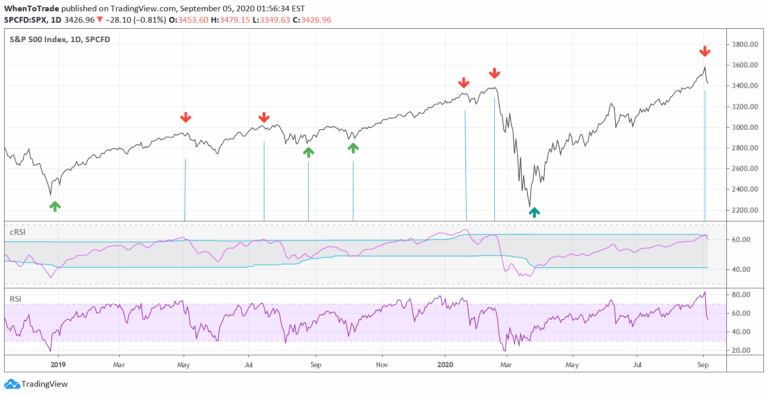
An enhanced RSI indicator that uses cyclic smoothing and adaptive bands to provide more responsive market trend signals by incorporating dominant cycle length.
Explore 11,183 indicators. Filter beyond the obvious.
Discover the tools that fit the way you trade.
11,183 tools to explore
An enhanced RSI indicator that uses cyclic smoothing and adaptive bands to provide more responsive market trend signals by incorporating dominant cycle length.
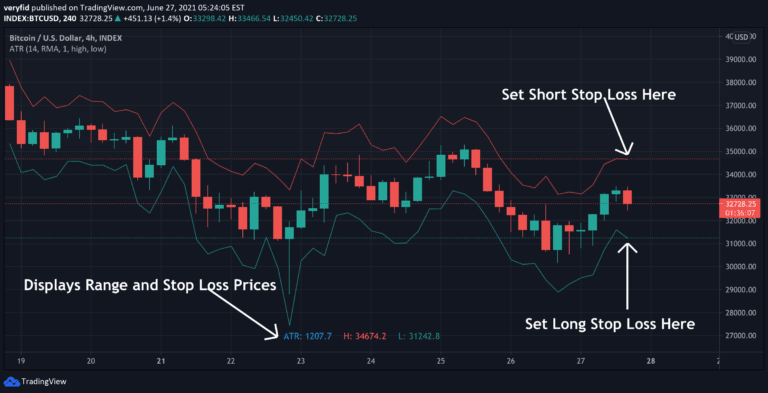
An ATR-based indicator that helps traders set adaptive stop losses by calculating safe exit points using volatility measurement. Prevents premature stop-outs and provides dynamic risk management.
NR4 & NR7 is a pattern recognition indicator that identifies narrow range candles to detect potential market breakouts and low volatility transitions.
An advanced RSI-based indicator that identifies periods of suppressed volatility, visualizes suppression zones, and highlights potential breakout dynamics in price movements.
A comprehensive trading toolkit that combines momentum, volatility, and price action analysis to provide insights into market trends, momentum, and potential reversals.
A grid trading strategy using martingale position sizing that doubles position size after losses, aiming to recover from previous trades by increasing exposure with each unsuccessful trade.
Top G Indicator helps traders identify market extremes by spotting high-probability tops and bottoms using dynamic range analysis and momentum shifts.
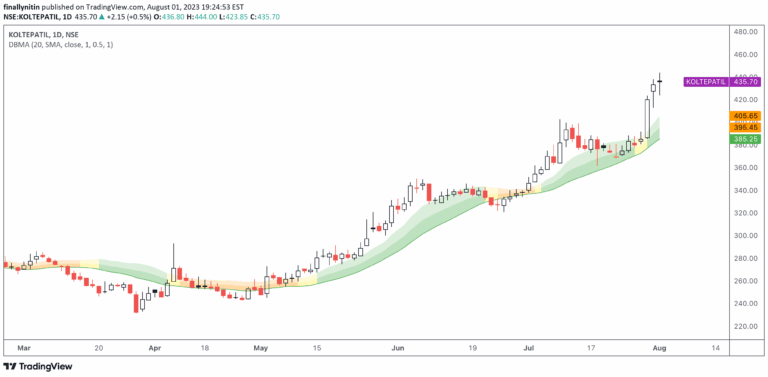
A Dual Bollinger Moving Average (DBMA) indicator that uses moving averages and Bollinger Bands to analyze price compression and potential trading opportunities.
Rolling ATR Bands is a dynamic indicator that uses Average True Range to create adaptive price bands, providing visual insights into trend strength and potential market reversals.
A versatile technical indicator using median Kijun-Sen to identify market trends, entry/exit points, and potential overbought or oversold conditions across multiple trading modes.
Range Tightening Indicator tracks price volatility, identifying low-volatility consolidation periods that potentially signal upcoming market breakouts and momentum shifts.
Advanced RSI tool that integrates momentum strength analysis, trend conviction measurement, and consolidation zone detection for more contextual market insights.
Likes, views, and comments are historical TradingView snapshots. They describe attention, not trading performance.