Adaptive Kalman Trend Filter (Zeiierman)
An advanced trend-following indicator using Kalman Filter technology to dynamically track market trends, adapting to changing conditions through sophisticated statistical algorithms.
Explore 11,183 indicators. Filter beyond the obvious.
Discover the tools that fit the way you trade.
11,183 tools to explore
An advanced trend-following indicator using Kalman Filter technology to dynamically track market trends, adapting to changing conditions through sophisticated statistical algorithms.
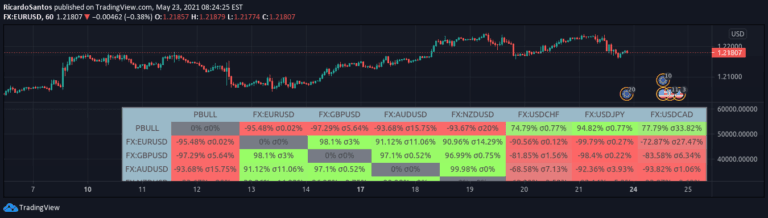
A Correlation Matrix utilizes statistical tables to analyze relationships between different financial variables, helping traders understand interconnected market behaviors and potential predictive patterns.
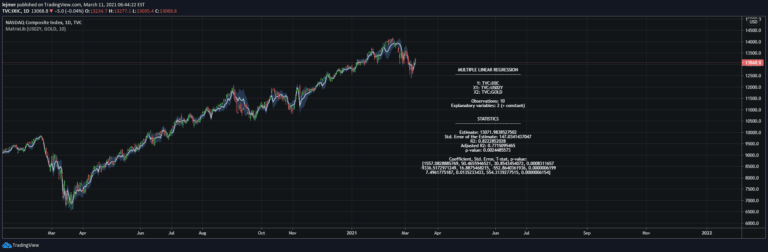
A comprehensive matrix math library for Pine Script that enables advanced mathematical operations, multiple linear regression, and solving complex linear equation systems for trading analysis.
A correlation matrix tool that reveals linear relationships between different cryptocurrency trading symbols, helping traders understand market interconnectedness and potential trading opportunities.
A mathematical approach to creating complex 3D data structures and arrays in Pine Script, enabling advanced data processing and analysis for trading strategies.
A pseudo Random Forest classification algorithm that uses decision matrices to predict potential breakouts or trend movements using two independent variables like RSI and Z-Score.
A Markov Chain Trend Indicator that analyzes stock price movements by calculating probabilities of transitioning between market states to predict potential future trends.
A Markov Chain-based indicator that predicts potential price movements by analyzing historical state transitions and calculating probabilities of future market states.
A Pine Script 3D bowling game demonstration showcasing the platform's interactive potential beyond traditional trading indicators, allowing users to play a bowling game within the trading environment.
A correlation matrix that visually represents stock relationships by measuring how price changes relate to each other across different securities.
A correlation matrix visualizing stock price change relationships through color-coded connections, helping traders understand complex market interactions and potential interdependencies.
Likes, views, and comments are historical TradingView snapshots. They describe attention, not trading performance.