YOUR INDICATOR RESEARCH STARTS HERE

Find the right indicator.
Understand what it does.

Explore 11,183 indicators. Filter beyond the obvious.
Discover the tools that fit the way you trade.

THE INDICATOR LIBRARY

Results for “motion”

11,183 tools to explore

22 indicators matching your filters
Save search
TrendVolatility

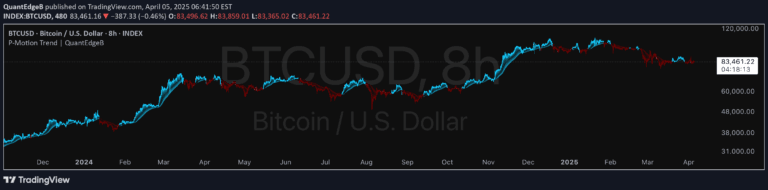
P-Motion Trend | QuantEdgeB

by QuantEdgeB

P-Motion Trend is an advanced trend-following indicator that uses DEMA filtering, percentile smoothing, and volatility-adjusted envelopes to detect market trends with minimal lag and high precision.

Main price chart · unverifiedDay Trading · Swing Trading
Explore
509likes6.1Kviews4comments
Save
TrendMomentumEditor’s pick

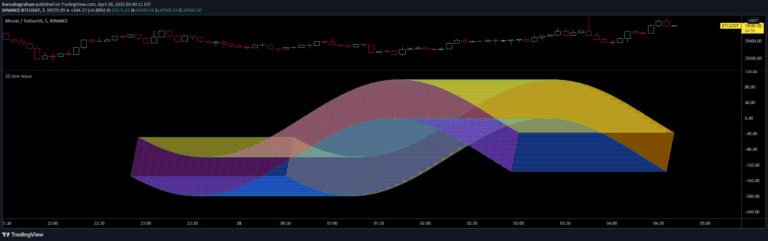
3D Sine Wave

by barnabygraham

A unique 3D sine wave visualization that allows traders to create dynamic visual representations of market data by mapping inputs to a moving cube following a sine wave pattern.

Main price chart · unverifiedDay Trading · Swing Trading
Explore
266likes29.8Kviews12comments
Save
OscillatorSignalTrend

Wave Trend

by Ox_kali

Wave Trend indicator is a sentiment analysis tool that helps traders understand market trends by calculating average investor satisfaction through colored squares on a chart.

Separate pane · unverifiedSwing Trading
Explore
148likes8Kviews1comments
Save
TrendSignal

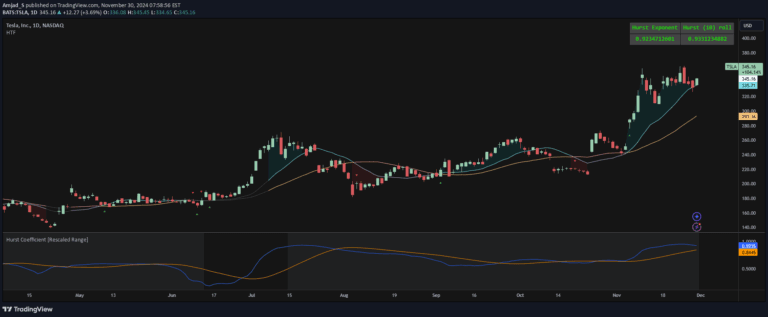
Hurst Exponent Trend filter

by Amjad_S

A trading indicator using the Hurst Exponent to categorize market states, identifying trending, random, and mean-reverting markets by analyzing time series auto-correlation.

Main price chart · unverifiedDay Trading · Swing Trading
Explore
113likes4.8Kviews7comments
Save
TrendSignal

Recursive Moving Average Difference

by wbburgin

A technical indicator that calculates weighted moving average differences to reveal price trajectory and potential trend direction by comparing multiple moving average lengths.

Separate pane · unverifiedScalping · Day Trading
Explore
92likes2.5Kviews0comments
Save
SignalVolatility

Long Wick Indicator

by dontgetemotional

A technical indicator that identifies candles with long wicks, highlighting potential price action signals and market volatility through custom wick-to-body ratio analysis.

Main price chart · unverifiedScalping · Day Trading
Explore
90likes2Kviews0comments
Save
SignalTrendVolatility

[SGM Geometric Brownian Motion]

by Sigaud

A financial modeling tool using Geometric Brownian Motion to simulate potential price trajectories, helping traders visualize potential market movements and assess associated risks.

Main price chart · unverifiedDay Trading · Swing Trading
Explore
70likes2Kviews0comments
Save
SignalTrend

Planetary Retrograde Dashboard

by Javonnii

A visual dashboard tracking planetary retrograde motions across different timeframes, offering unique insights into potential market behavioral shifts through astronomical observations.

Main price chart · unverifiedSwing Trading
Explore
63likes1.3Kviews0comments
Save

Likes, views, and comments are historical TradingView snapshots. They describe attention, not trading performance.

START WITH A QUESTION

A little less searching.
A lot more understanding.

Tell DeepAlpha what you need. Get an explanation, a shortlist,
and a direct path to the indicators behind it.

Ask DeepAlpha