Volume / Open Interest "Footprint" - By Leviathan
A footprint bar indicator that visualizes volume or open interest data within the chart's visible range, offering three different heatmap styles to analyze trading activity.
Explore 11,183 indicators. Filter beyond the obvious.
Discover the tools that fit the way you trade.
11,183 tools to explore
A footprint bar indicator that visualizes volume or open interest data within the chart's visible range, offering three different heatmap styles to analyze trading activity.
Live Economic Calendar tracks global financial news events, providing real-time updates on market-moving events across multiple currencies with impact levels and detailed visualizations.
A versatile trading tool that generates price targets based on multiple technical indicators, helping traders set profit levels and manage risk dynamically.
A technical analysis tool that identifies dynamic support and resistance levels by connecting past pivot high and low points, which can be applied to various indicators and chart types.
Fair value bands assess price behavior by tracking deviations from a mean basis, helping traders identify normal and abnormal price movements through dynamic statistical bands.
A versatile technical indicator using median Kijun-Sen to identify market trends, entry/exit points, and potential overbought or oversold conditions across multiple trading modes.
A comprehensive Bitcoin data retrieval script that tracks multiple blockchain and market metrics, providing detailed insights into Bitcoin's performance and network activity.
A versatile SuperTrend toolkit that extends trend analysis by integrating the SuperTrend algorithm with various indicators, enabling comprehensive market trend insights across different data sources.
A range filter indicator using Nadaraya-Watson Envelope with custom SMA overlays to predict potential price trend changes and reversals with custom signal generation.
A multi-RSI plotting technique that allows customization of five different RSI indicators with varying parameters like source, length, timeframe, color, and visual representation.
A comprehensive moving average indicator with multiple configuration options, featuring three advanced moving averages that can be customized with various inputs and visualization settings.
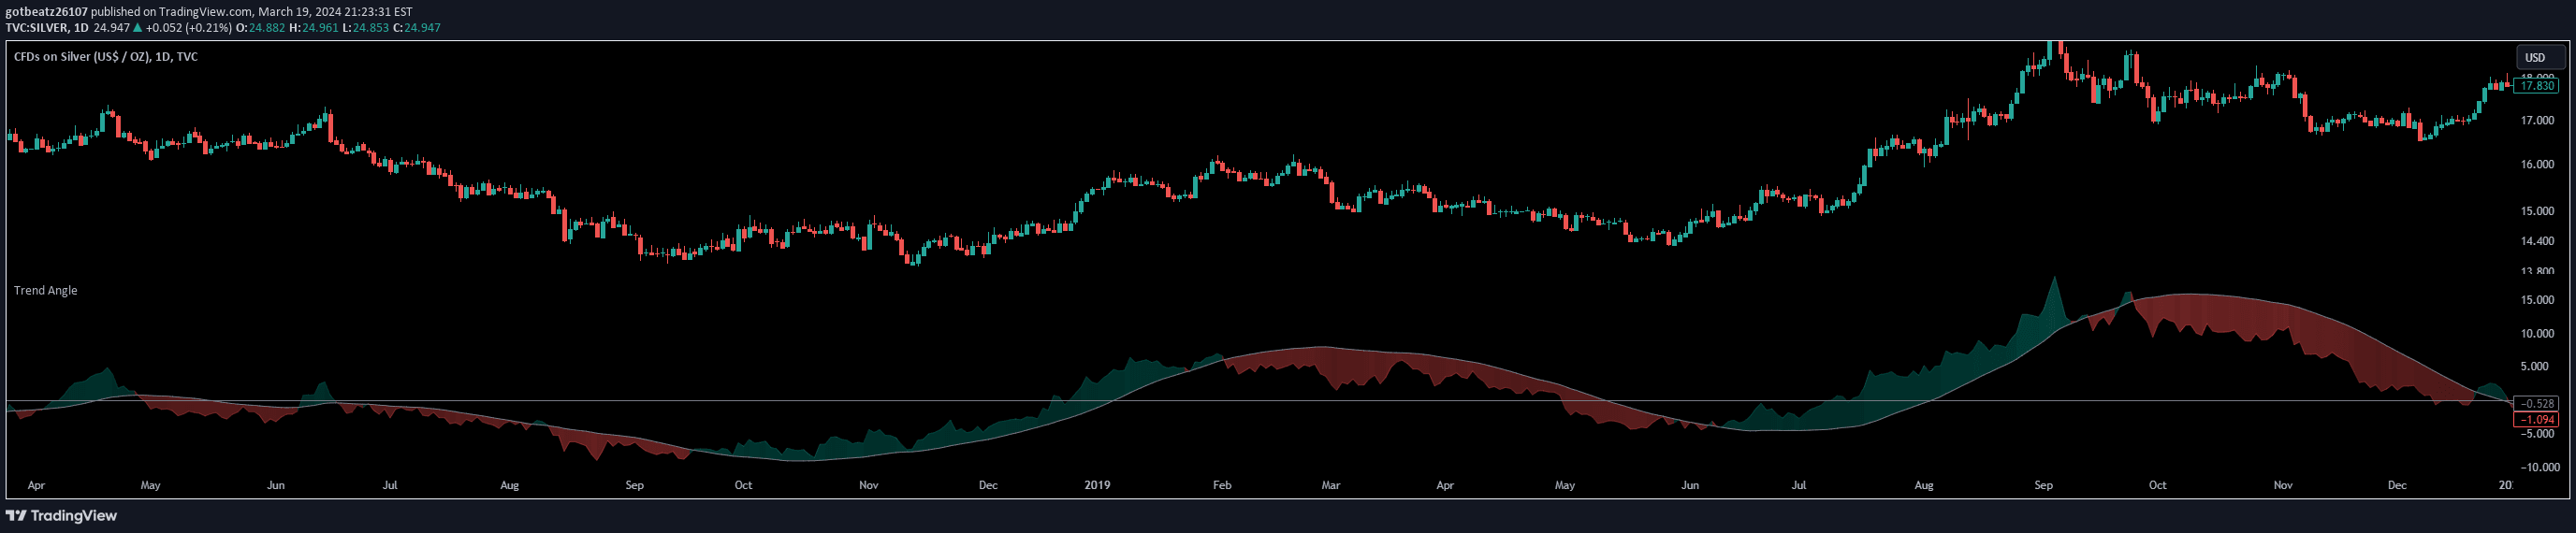
Trend Angle calculates the inclination of price movements over a specified timeframe, providing traders with a quantitative method to assess market directionality and momentum.
Likes, views, and comments are historical TradingView snapshots. They describe attention, not trading performance.