SMT Divergences [LuxAlgo]
An indicator that identifies divergences between swing points of a chart symbol and two external tickers, providing statistical insights into price behavior correlation.
Explore 11,183 indicators. Filter beyond the obvious.
Discover the tools that fit the way you trade.
11,183 tools to explore
An indicator that identifies divergences between swing points of a chart symbol and two external tickers, providing statistical insights into price behavior correlation.
A multi-ticker dashboard that visually tracks swing structures across different timeframes, helping traders identify potential trend formations and market confluence.
An advanced screener that identifies and tracks order blocks across 5 tickers, providing insights into market order volumes, status, and potential trading opportunities.
A Pine Script technique for combining multiple cryptocurrency price data into a single composite ticker using advanced request.security() method, enabling efficient multi-ticker analysis.
A polar chart tool that visualizes cryptocurrency dominance by combining traded dollar volume and volatility across multiple timeframes for easy comparative analysis.
Market Structures Screener identifies key market trend changes across 5 tickers by detecting Break of Structure (BOS) and Change of Character (CHoCH) patterns.
A machine learning tool that groups tickers with similar correlation coefficients to help traders analyze asset relationships and optimize trading strategies.
A Fair Value Gap Screener that identifies market imbalances across 5 tickers, providing detailed insights into gap characteristics, retests, and volume dynamics.
A sophisticated screener detecting breaker blocks across 5 tickers, providing real-time insights into order block failures, volume, and price dynamics for advanced trading strategies.
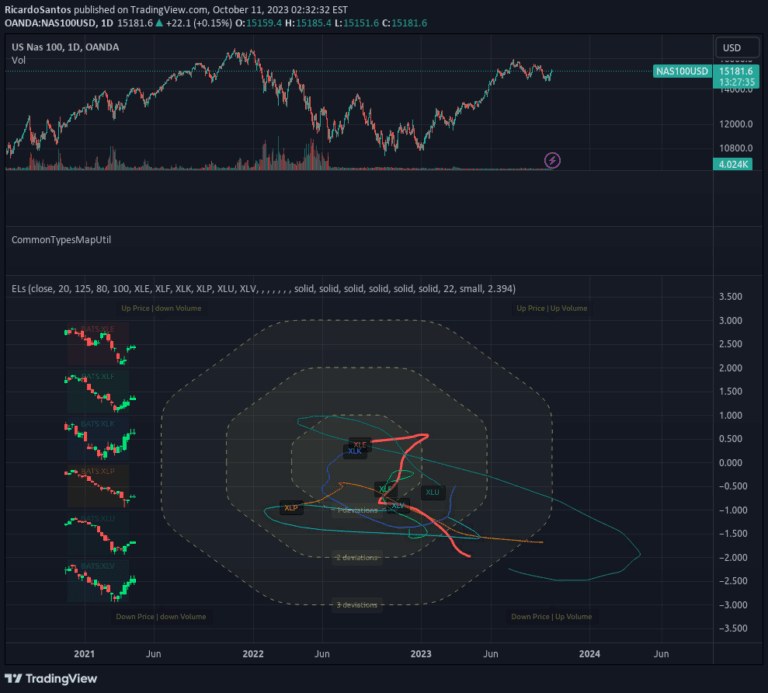
An expanded crocker graph visualization technique that tracks multiple tickers simultaneously, providing a comprehensive market overview with embedded commodity candle details.
A correlation matrix indicator that calculates Pearson correlation coefficients between multiple financial instruments, revealing how different assets' returns move in relation to each other.
A multi-length RSI screener that analyzes up to 240 tickers simultaneously, tracking RSI overbought and oversold conditions across different periods.
Likes, views, and comments are historical TradingView snapshots. They describe attention, not trading performance.