Volume Delta Candles [LuxAlgo]
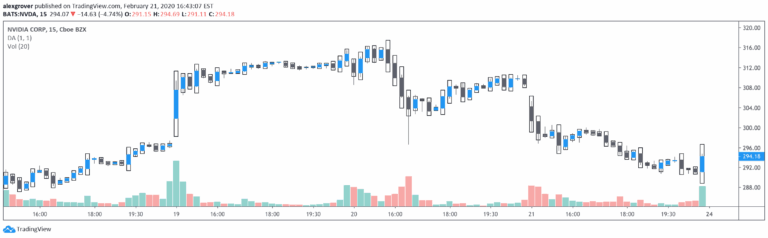
Volume Delta Candles analyze intrabar trading activity by comparing buy and sell volumes, providing visual insights into price movement and trading sentiment within each candle.
Explore 11,183 indicators. Filter beyond the obvious.
Discover the tools that fit the way you trade.
11,183 tools to explore
Volume Delta Candles analyze intrabar trading activity by comparing buy and sell volumes, providing visual insights into price movement and trading sentiment within each candle.
A volume delta indicator that analyzes intrabar volume to estimate buying and selling pressure by calculating five distinct volume balances and divergence channels.
A volume footprint indicator that divides candles into intervals, showing the distribution of trading volume across different price levels within a single candlestick.
A trading tool that visualizes candle bodies with the highest volume on a lower timeframe, highlighting areas of significant market activity using color-coded heatmaps and interval lines.
Volume Delta is an advanced indicator that analyzes trading volumes, revealing buy-sell activities and market momentum through color-coded candlestick visualizations.
A volume-based trading tool that identifies high-impact candles and reveals hidden liquidity zones by analyzing microstructure data across different timeframes.
EquiVolume is a charting method that integrates volume information into candlestick charts by adjusting candle width based on trading volume, providing visual insights into market activity.
An advanced volume analysis tool that visualizes supply and demand dynamics by tracking buyer and seller strength within candlesticks, helping traders understand market momentum and potential trend reversals.
Dekidaka-Ashi is a unique candlestick visualization tool that integrates volume data with price action, creating enhanced candlesticks that reveal trading activity and potential market movements.
A volume-based indicator that breaks down higher timeframe candles into 10 segments, revealing volume distribution and market sentiment across different timeframes.
A specialized indicator that detects high-volume trading bars by comparing current volume against a moving average and customizable volume multiplier settings.
A volume-based indicator that highlights the most active trading candles, helping traders identify significant market moments with color-coded volume visualization.
Likes, views, and comments are historical TradingView snapshots. They describe attention, not trading performance.