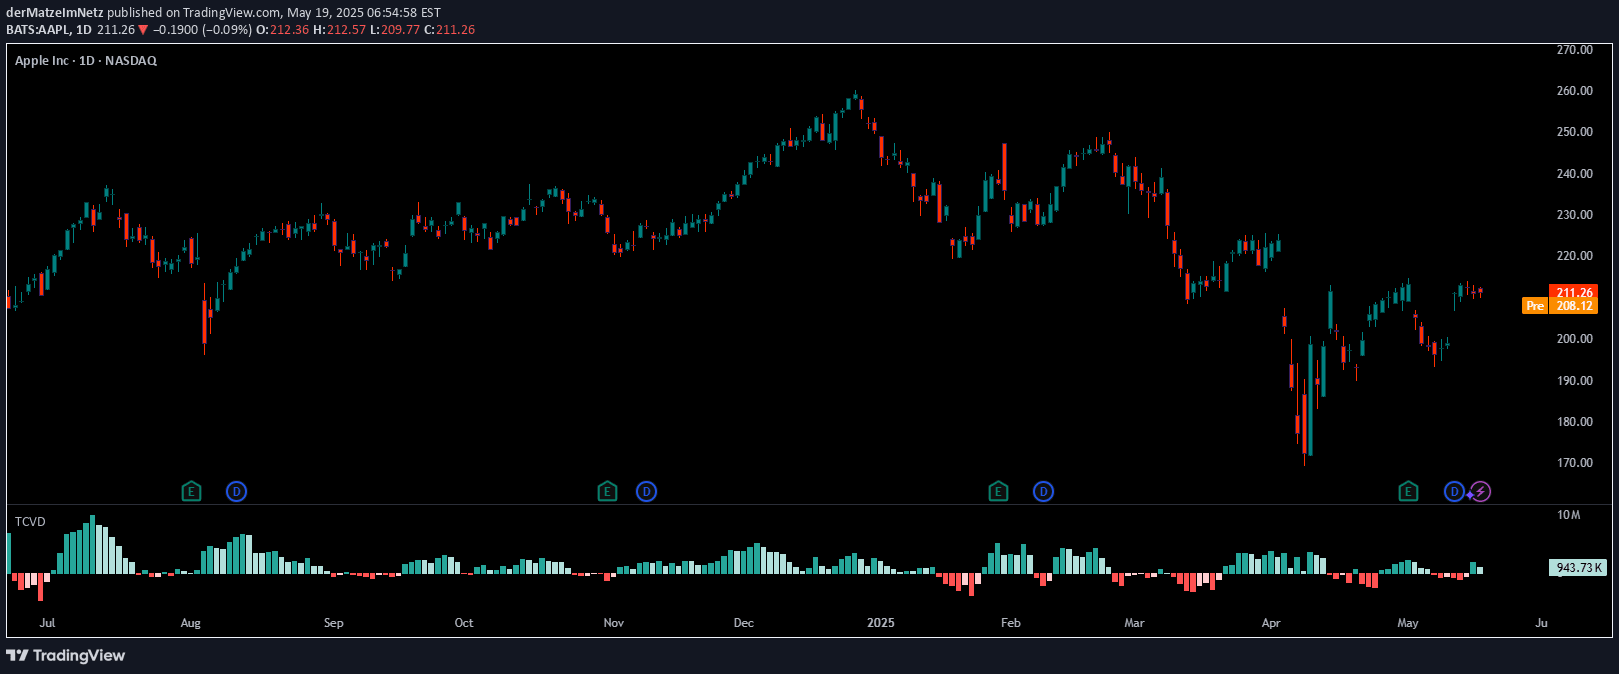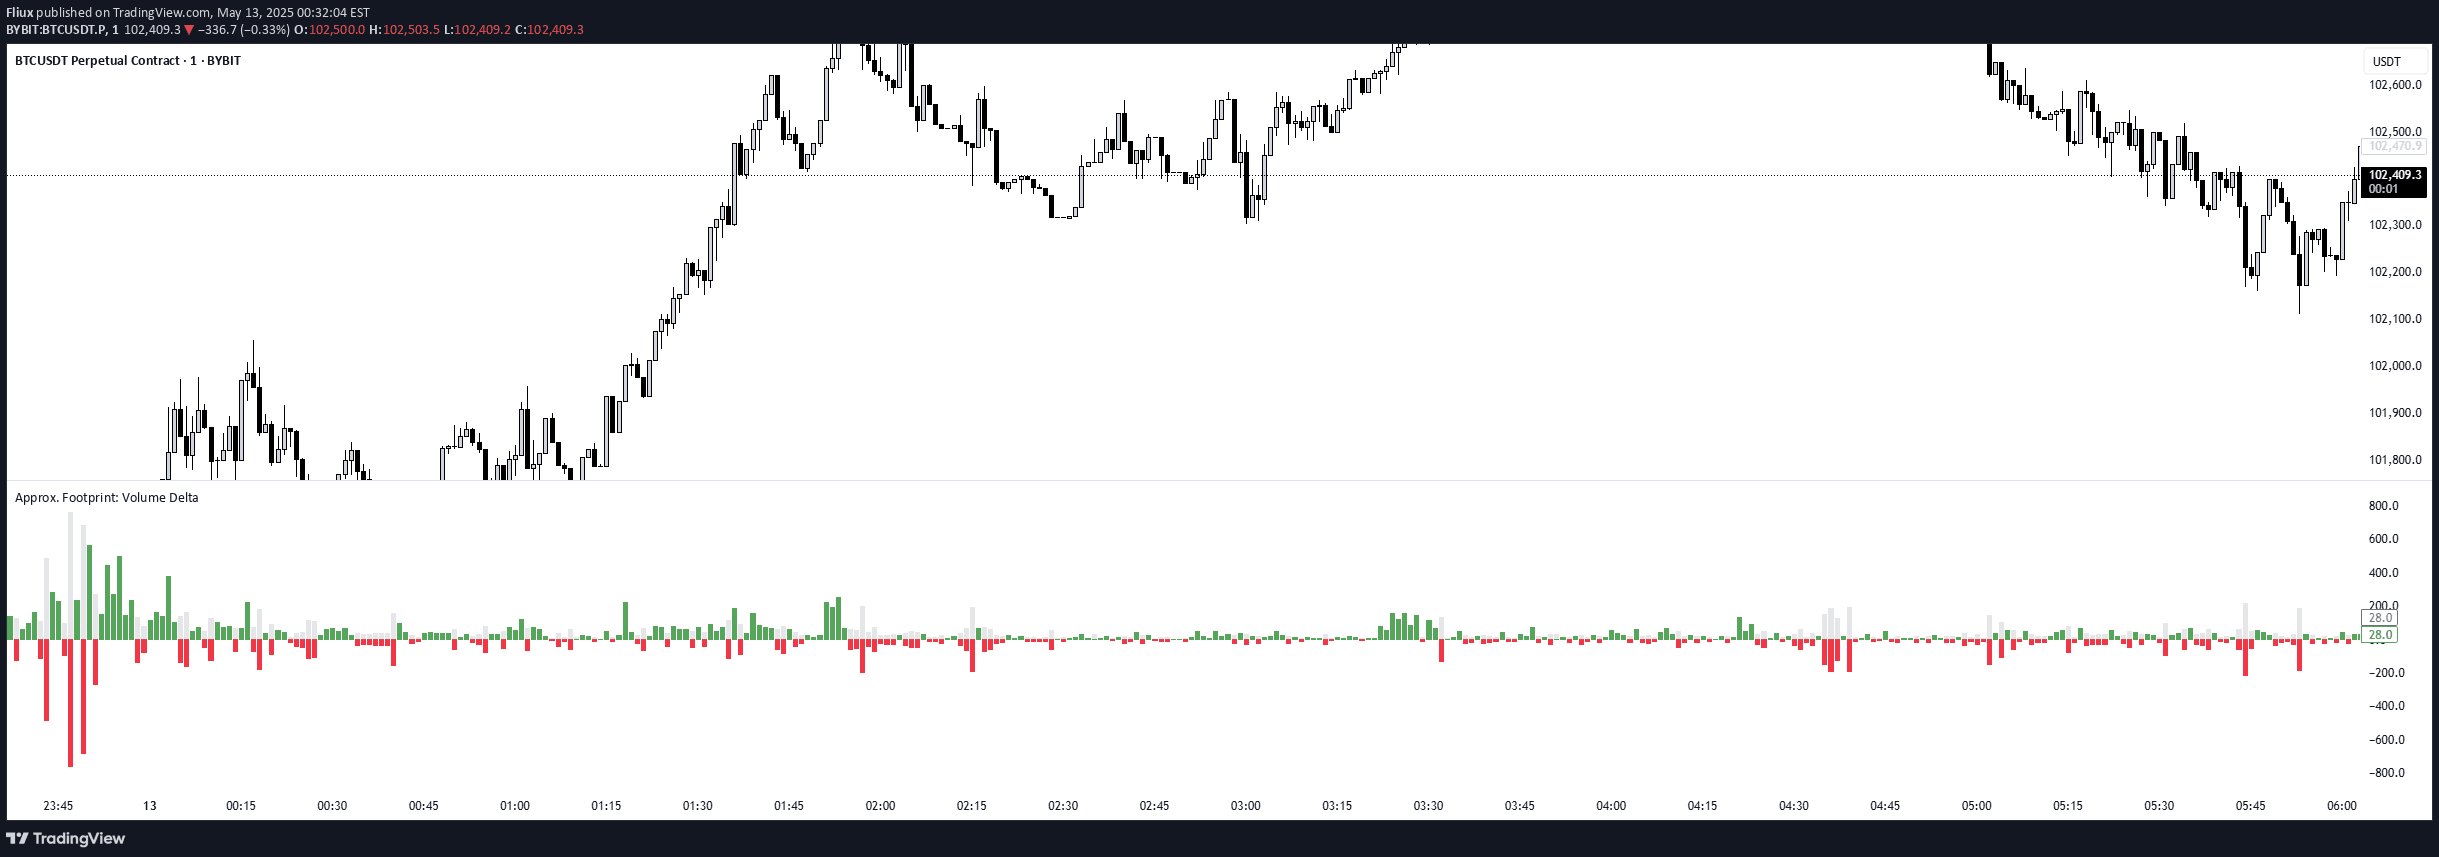
A volume delta indicator that reveals buying and selling pressure by charting the imbalance between bullish and bearish volume across price bars.
Explore complementary indicator rolesHow it works
The volume delta indicator calculates the difference between bullish and bearish volume within each price bar, creating color-coded columns that represent market sentiment. Green columns indicate bars where buyers dominated, while red columns show bars where sellers controlled price action.
By displaying total volume in semi-transparent gray in the background, the indicator provides additional context about overall trading activity. The visualization allows traders to quickly understand the strength of buying or selling pressure without requiring complex tick-by-tick or bid/ask data feeds.
Why it may be useful
Volume delta helps traders understand the underlying market dynamics beyond simple price movement by revealing the actual force behind price changes. It provides insights into whether price moves are supported by genuine trading activity or potentially weak and unsustainable.
By showing volume imbalances, traders can more accurately assess market momentum, identify potential trend reversals, and make more informed trading decisions. The indicator offers a clear, visual representation of market sentiment that can complement other technical analysis tools.
When to explore it
The volume delta indicator is most effective in markets with significant trading volume and clear price trends. It works best during active trading sessions when there's sufficient market participation and liquidity.
Traders should use this indicator to confirm breakouts, assess momentum shifts, and validate potential trend reversals. It is particularly useful for short-term trading strategies like scalping and day trading, where understanding immediate market sentiment can provide a critical edge in decision-making.
Keep exploring
What we’ve verified
Access, alerts and repainting behaviour have not been independently verified for this indicator. Check the creator’s current publication and settings.
General descriptions and classifications are recovered research. Verified details above identify the specific checks we have completed. Check the creator’s current publication for later changes.