Machine Learning: Logistic Regression
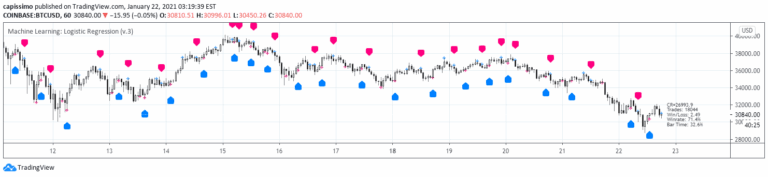
A machine learning strategy using logistic regression to classify market movements into binary categories by fitting a sigmoid curve to predict potential trading directions.
Explore 11,183 indicators. Filter beyond the obvious.
Discover the tools that fit the way you trade.
11,183 tools to explore
A machine learning strategy using logistic regression to classify market movements into binary categories by fitting a sigmoid curve to predict potential trading directions.
A sophisticated logistic regression indicator that identifies and predicts support and resistance levels using advanced statistical modeling and market condition analysis.
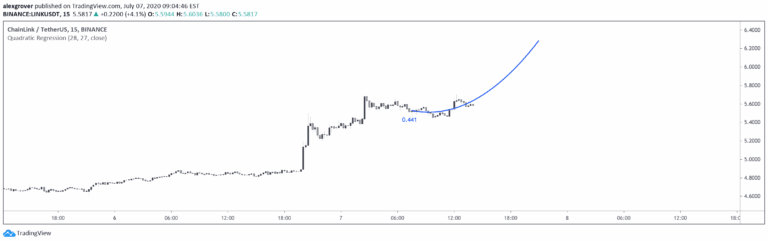
A quadratic regression indicator that fits a parabolic curve to price data, allowing traders to analyze non-linear trends and potentially forecast future price movements.
A dynamic trend-following oscillator based on CCI that tracks market trends, identifies potential reversals, and provides visual trend confirmation through adaptive trailing stops and color-coded alerts.
A comprehensive trading system using machine-engineered signals combining RSI, SuperTrend, and adaptive candle coloring for precise market entry and trend detection.
A machine learning trading indicator using logistic regression that combines multiple technical indicators to generate potential buy and sell signals with systematic decision-making.
A dynamic RSI-based regression channel that adapts to market momentum by resetting its trend analysis when RSI crosses overbought or oversold levels, revealing potential trend shifts.
A scalping indicator using RSI crossovers and moving averages to generate trading signals. Combines multiple technical analysis tools to identify potential trend reversals and momentum shifts.
A trading indicator that identifies Fair Value Gaps (FVGs) across multiple timeframes, helping traders spot market inefficiencies and potential trading opportunities.
A dynamic trading indicator that combines Rolling Volume Weighted Average Price (VWAP) with Discrete Fourier Transform for advanced harmonic analysis and trend identification.
A Stochastic RSI Screener that allows monitoring of a single symbol across three different timeframes, providing comprehensive trading insights and flexibility.
A dynamic ticker tape that displays real-time price updates and daily changes for multiple securities, scrolling horizontally across the chart bottom for instant market insights.
Likes, views, and comments are historical TradingView snapshots. They describe attention, not trading performance.