RSI cyclic smoothed v2
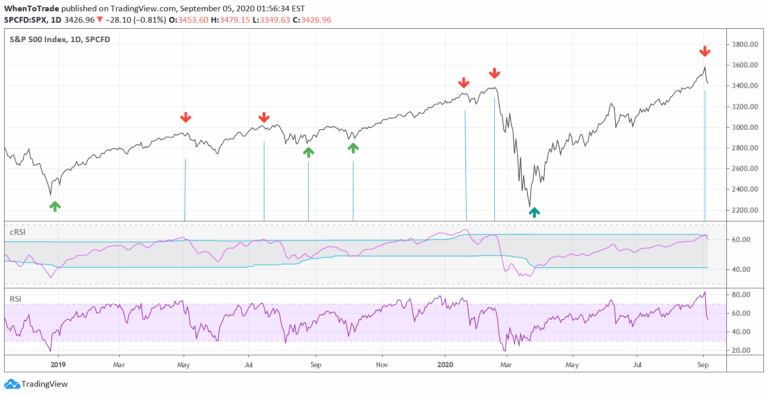
An enhanced RSI indicator that uses cyclic smoothing and adaptive bands to provide more responsive market trend signals by incorporating dominant cycle length.
Explore 11,183 indicators. Filter beyond the obvious.
Discover the tools that fit the way you trade.
11,183 tools to explore
An enhanced RSI indicator that uses cyclic smoothing and adaptive bands to provide more responsive market trend signals by incorporating dominant cycle length.
A trading script that projects future pivot points by analyzing historical price patterns and calculating potential next pivot locations using statistical analysis of market movements.
A sophisticated market cycle detection method that uses Detrended Price Oscillator to identify rhythmic patterns and dominant cycles in price movements, helping traders optimize technical indicator settings.
A multi-indicator trading tool that uses Ehlers' bandpass filter and Voss predictor to anticipate potential cyclic turning points in market price movements.
A sophisticated signal processing technique that identifies dominant market cycles by applying linear predictive filters to price data, helping traders adapt strategies to changing market conditions.
A bandpass filter indicator analyzing price motion through 11 spectral filters, enabling traders to predict future price highs and lows using cyclic price components.
A sophisticated oscillator by John F. Ehlers that uses two-pole highpass and lowpass filters to create a flexible, normalized indicator that captures specific market cycle frequencies.
A Money Flow Index enhanced with Discrete Fourier Transform smoothing to filter market noise and provide clearer trend identification through advanced frequency analysis.
A digital signal processing technique for trend detection that uses highpass filters to create a responsive trend indicator with minimal lag, revealing price movement dynamics.
An advanced market regime classifier that identifies price trends and volatility phases using sophisticated computational techniques and adaptive clustering algorithms.
Advanced technical indicator using Goertzel algorithm to detect and analyze dominant market cycles, helping traders identify underlying price movement patterns and potential trading opportunities.
A custom TradingView indicator that visualizes cyclic market phases, dividing trading sessions into quarters and identifying potential support and resistance levels.
Likes, views, and comments are historical TradingView snapshots. They describe attention, not trading performance.