FX Market Sessions
An FX market indicator that segments trading times into specific zones, providing visual guidance for traders using timeframes of 60 minutes or less.
Explore 11,183 indicators. Filter beyond the obvious.
Discover the tools that fit the way you trade.
11,183 tools to explore
An FX market indicator that segments trading times into specific zones, providing visual guidance for traders using timeframes of 60 minutes or less.
A technical indicator that highlights previous day's high and low points, uses daily and weekly separators to create a clean chart that helps traders understand potential market direction.
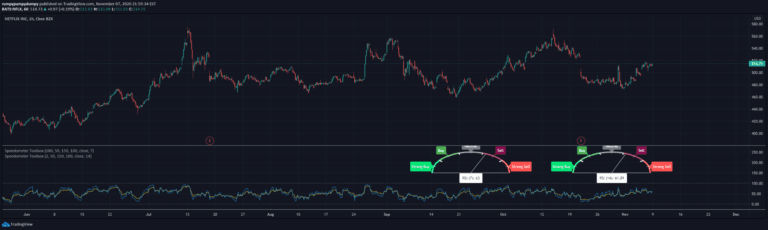
Custom metric speedometers provide specialized visualization techniques for tracking and representing performance indicators through graphical gauge-like representations.
A powerful FIR filter moving average indicator designed to smooth price data, reduce noise, and provide customizable trend visualization with advanced color and alert features.
Trading Checklist is a customizable indicator that helps traders maintain discipline by creating and displaying personalized trading rules directly on a TradingView chart.
The Variable Index Dynamic Average (VIDA) is a trend-following indicator that dynamically adjusts its averaging period based on market conditions, providing adaptive insights into price movements.
A novel trend oscillator developed by Dr. John Ehlers that provides near zero-lag averaging with consistent performance across multiple timeframes and candle durations.
A multiple information panel using tables provides traders with comprehensive visual data representations across various trading metrics, enabling quick and efficient analysis of complex market information.
Advanced Stochastic ForLoop is an improved stochastic indicator that calculates trend signals by analyzing price movements across multiple moving average lengths and signal modes.
OKX Signal BOT is a strategy scanning and trading tool for cryptocurrency futures on the OKX exchange, allowing traders to design custom trading strategies and automate signal execution.
SUPeR TReND 2.718 is an advanced Supertrend indicator using Euler's constant, providing precise trend detection with dynamic visual layers and customizable trend tracking.
A versatile trading indicator that calculates potential price levels before and after a start point, offering flexible visualization of market highs, lows, and price movements.
Likes, views, and comments are historical TradingView snapshots. They describe attention, not trading performance.