ICT NWOG/NDOG & EHPDA [LuxAlgo]
A trading indicator identifying weekly and daily opening gaps alongside Event Horizon Price Discovery Arrays, designed to highlight potential support and resistance zones.
Explore 11,183 indicators. Filter beyond the obvious.
Discover the tools that fit the way you trade.
11,183 tools to explore
A trading indicator identifying weekly and daily opening gaps alongside Event Horizon Price Discovery Arrays, designed to highlight potential support and resistance zones.
A comprehensive indicator analyzing daily price range, volatility compression, and trading opportunities through NR7, WR20, TTM Squeeze, and Average Daily Range metrics.
A population sampled linear regression model that analyzes price momentum, distribution moments, and potential pivot points using statistical analysis and standard deviation tracking.
A technical indicator defining an intraday noise area based on historical price movements, identifying potential significant price imbalances and trend initiation points.
An ICT-based indicator that identifies the first fair value gap after market open, highlighting price imbalances and potential market movements with customizable visualization options.
An indicator analyzing liquidity engulfing candles across multiple timeframes, revealing potential market structure breaks and displacement opportunities using ICT trading principles.
VWAP is a volume-weighted average price indicator that tracks price movement relative to volume, helping traders identify potential support and resistance levels.
A probabilistic trading signal that evaluates potential price movements by comparing likelihood of price increases versus decreases. Helps traders predict potential price discovery scenarios using comparative probability analysis.
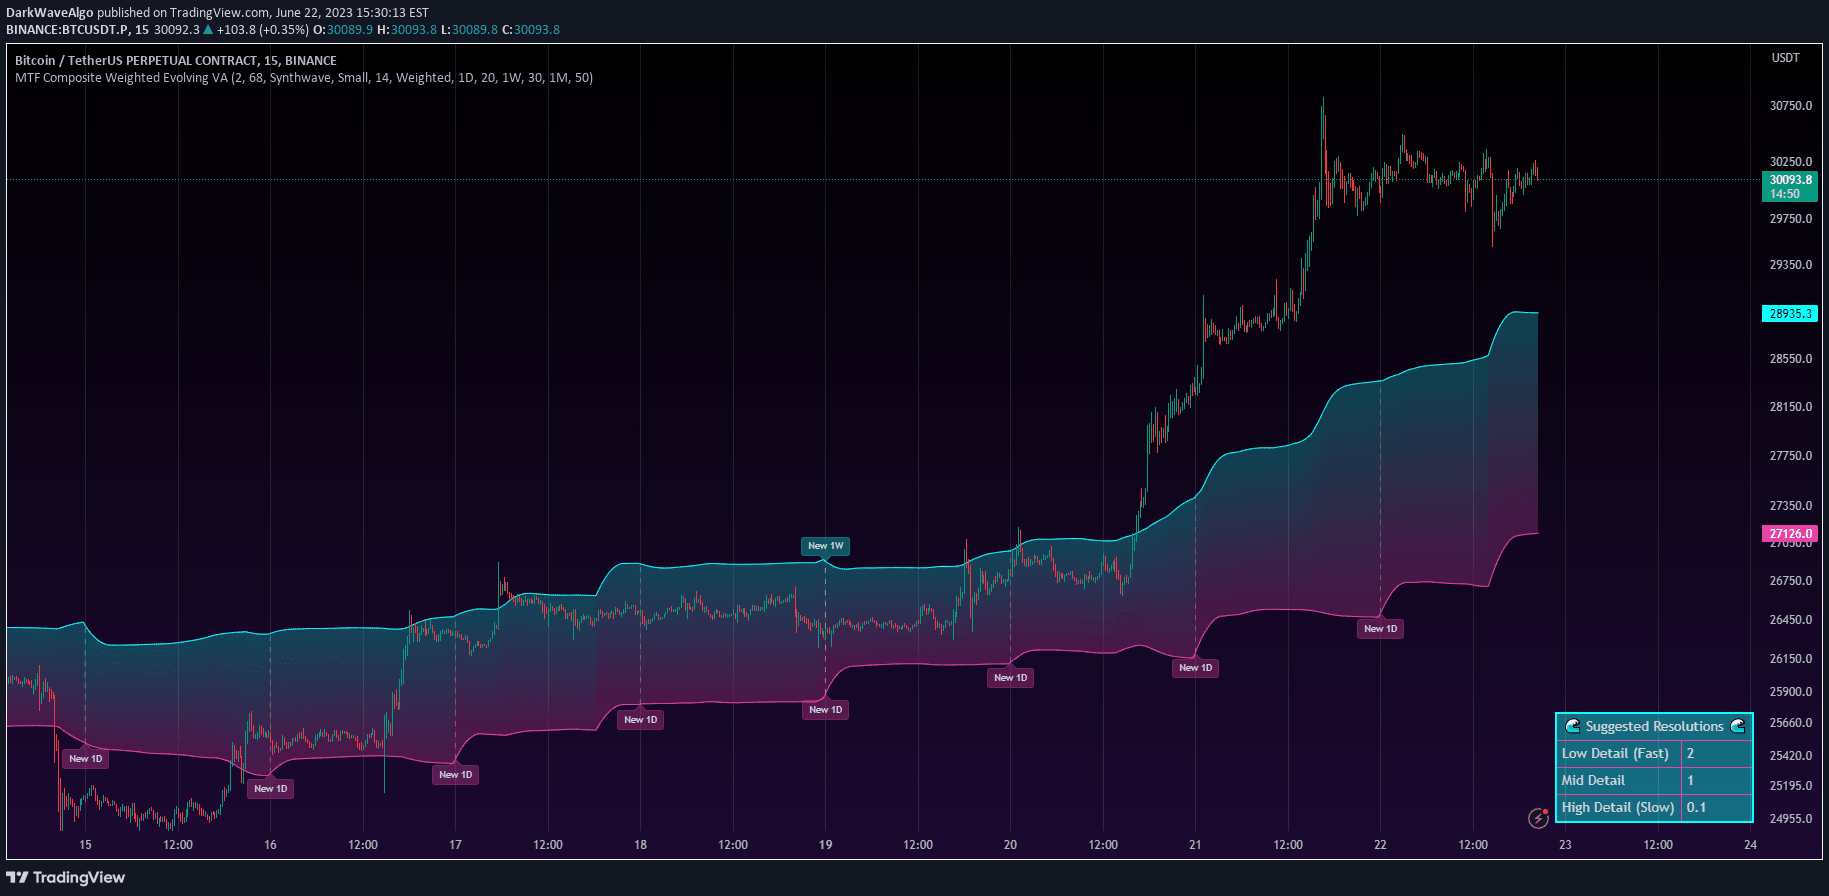
A multi-timeframe evolving value area indicator that calculates trading activity zones across different periods, providing dynamic insights into market value ranges.
The Discovery Index is a technical indicator that measures market pressure and momentum by tracking new highs and lows across price and volume data through a unique candlestick histogram approach.
Settlement prices indicator plotting up to 30 historical settlement prices on charts under 1-hour timeframes, helping traders track daily market valuation and price discovery.
VW-TWAP combines volume and time-weighted pricing to reveal market consensus, highlighting fair value zones by integrating trading activity and price movements.
Likes, views, and comments are historical TradingView snapshots. They describe attention, not trading performance.