MA Sabres [LuxAlgo]
MA Sabres is a trend reversal indicator that uses moving averages to detect potential market direction changes and visualize them with sabre-shaped graphical elements.
Explore 11,183 indicators. Filter beyond the obvious.
Discover the tools that fit the way you trade.
11,183 tools to explore
MA Sabres is a trend reversal indicator that uses moving averages to detect potential market direction changes and visualize them with sabre-shaped graphical elements.
A liquidity trap reversal indicator that identifies potential market turning points by analyzing price action, volume spikes, and trend dynamics using advanced detection algorithms.
A chart overlay indicator using Bollinger Bands and RSI to identify potential market reversals by highlighting overbought and oversold conditions with color-coded zones.
An advanced trend reversal indicator combining Hull Moving Average and Kahlman filter, designed to detect market direction changes in volatile assets like Bitcoin with high precision.
A moving average-based reversal indicator that generates trading signals by tracking market price position relative to a 13-period moving average, identifying potential trend changes.
A technical indicator identifying potential market reversals by analyzing candlestick characteristics like wick length and body size, helping traders pinpoint precise entry and exit points.
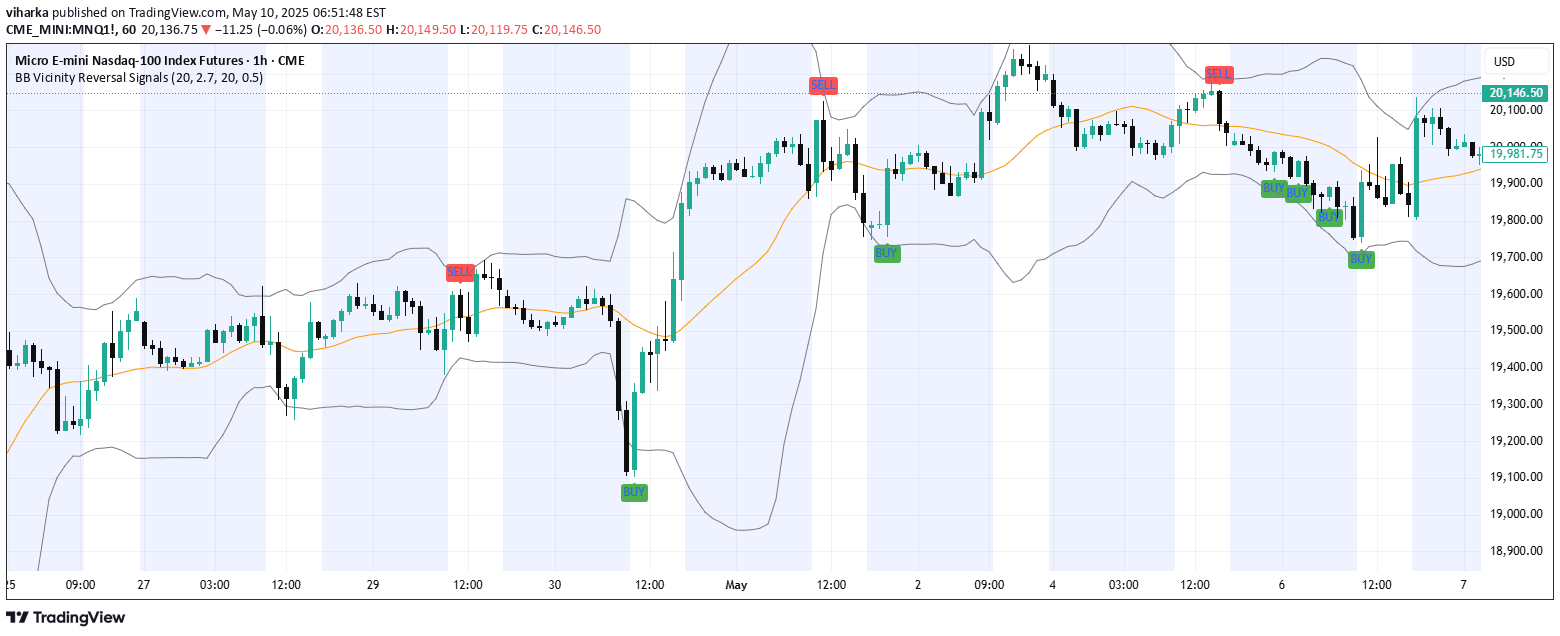
An intraday reversal indicator using Bollinger Bands that identifies potential mean-reversion trading opportunities by analyzing price action near outer band boundaries.
NVT Studio is a Bitcoin price reversal indicator that analyzes Network Value Transaction extremes and offers two visualization modes for identifying potential trend changes.
A MACD-based indicator that provides early warning signals for potential price reversals by analyzing the histogram difference between MACD and its signal line.
A pattern-based indicator identifying rare market reversal setups by analyzing consecutive candle formations and their relationship to the 20 EMA, highlighting potential turning points.
A statistical RSI-based indicator that identifies potential market reversals by analyzing pivot points and frequent RSI values, enhancing traditional RSI analysis for more precise trading signals.
A swing reversal indicator that combines smoothed price data with a modified RSI to help traders identify potential market trend changes and momentum shifts.
Likes, views, and comments are historical TradingView snapshots. They describe attention, not trading performance.