YOUR INDICATOR RESEARCH STARTS HERE

Find the right indicator.
Understand what it does.

Explore 11,183 indicators. Filter beyond the obvious.
Discover the tools that fit the way you trade.

THE INDICATOR LIBRARY

Results for “rotation”

11,183 tools to explore

89 indicators matching your filters
Save search
VolumeTrendSignalEditor’s pick

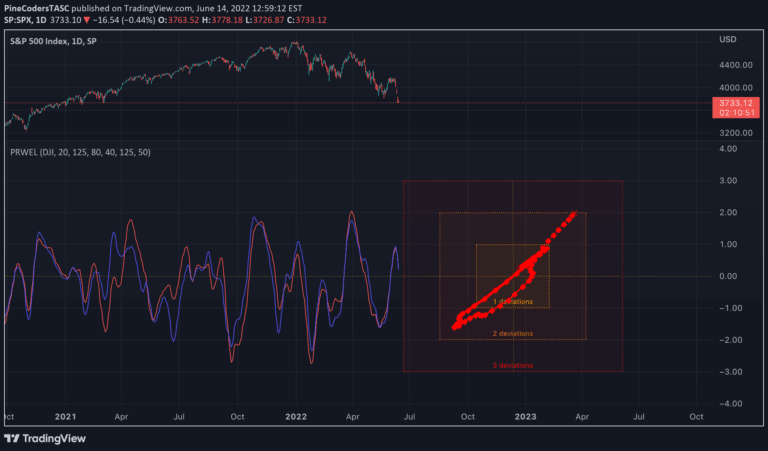
Ehlers Loops [BigBeluga]

by BigBeluga

The Ehlers Loops indicator reveals price and volume dynamics through a quadrant-based visual representation, helping traders understand market momentum and potential trend reversals.

Separate pane · unverifiedScalping · Day Trading
Explore
3Klikes107.3Kviews26comments
Save
SignalTrend

Market Monitor

by finallynitin

A dynamic market overview tool that tracks percentage changes across multiple indices or sectors, allowing traders to quickly assess performance and trends across different timeframes.

Separate pane · unverifiedDay Trading · Swing Trading
Explore
1.8Klikes18.6Kviews9comments
Save
MomentumOscillatorVolume

Asset Rotation Aperture

by ColeGarner

Asset Rotation Aperture tracks volume accumulation across multiple assets, visualizing capital rotation and market narratives through normalized cumulative volume lines.

Separate pane · unverifiedScalping · Day Trading
Explore
1.5Klikes19.1Kviews30comments
Save
VolumeTrendEditor’s pick

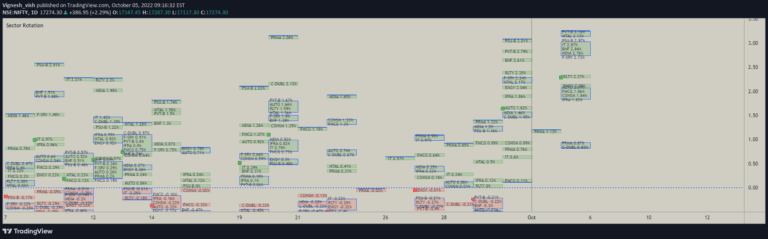
Sector Rotation

by Vignesh_vish

A comprehensive trading tool for visualizing and tracking performance across major Indian market sectors, allowing real-time and historical sector analysis with customizable visualization options.

Main price chart · unverifiedDay Trading · Swing Trading
Explore
1.3Klikes49.6Kviews32comments
Save
Momentum

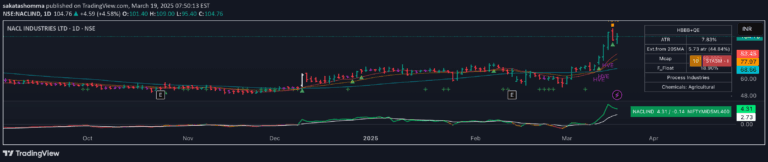
Mswing Homma

by sakatashomma

Mswing is a momentum oscillator measuring price change over 20 and 50 periods, helping traders assess market momentum, relative strength, and potential entry/exit points across different timeframes.

Separate pane · unverifiedSwing Trading
Explore
724likes6.6Kviews1comments
Save
SignalTrend

Historical Correlation [LuxAlgo]

by LuxAlgo

Historical Correlation tool calculates correlation coefficients between assets, revealing how different financial instruments move in relation to each other over time.

Separate pane · unverifiedScalping · Day Trading
Explore
693likes20.6Kviews4comments
Save
SignalTrend

Sector Relative Strength [Afnan]

by AfnanTAjuddin

A sector relative strength indicator that compares performance of multiple sector indices against a benchmark, helping traders identify outperforming and underperforming market segments.

Separate pane · unverifiedDay Trading · Swing Trading
Explore
398likes5.2Kviews6comments
Save
TrendMomentumEditor’s pick

The Investment Clock Orbital Graph

by BarefootJoey

The Investment Clock Orbital Graph is a macro trading tool that visualizes economic cycles by tracking GDP growth and CPI inflation rates across different market phases.

Separate pane · unverifiedDay Trading · Swing Trading
Explore
375likes20.4Kviews6comments
Save
LevelsSignalTrend

Dynamic Gann Levels [XrayTrades]

by XrayTrades

A dynamic Gann analysis indicator that calculates support and resistance levels by using pivot highs and lows with multiple rotation degrees for precise price predictions.

Main price chart · unverifiedScalping · Day Trading
Explore
323likes7.8Kviews4comments
Save

Likes, views, and comments are historical TradingView snapshots. They describe attention, not trading performance.

START WITH A QUESTION

A little less searching.
A lot more understanding.

Tell DeepAlpha what you need. Get an explanation, a shortlist,
and a direct path to the indicators behind it.

Ask DeepAlpha