YOUR INDICATOR RESEARCH STARTS HERE

Find the right indicator.
Understand what it does.

Explore 11,183 indicators. Filter beyond the obvious.
Discover the tools that fit the way you trade.

THE INDICATOR LIBRARY

Results for “scale”

11,183 tools to explore

239 indicators matching your filters
Save search
TrendEditor’s pick

Adaptive Trend Finder (log)

by Julien_Eche

The Adaptive Trend Finder is an advanced trading indicator that autonomously detects trend channels using logarithmic scale regression, offering flexibility in long-term or short-term trend analysis.

Main price chart · unverifiedSwing Trading
Explore
11.8Klikes291.8Kviews195comments
Save
LevelsSignal

Liquidity Pools

by FX365_Thailand

A liquidity indicator that identifies potential market order zones by mapping swing highs and lows, revealing where stop-loss orders and significant liquidity pools are likely positioned.

Main price chart · unverifiedScalping · Day Trading
Explore
5.1Klikes96.2Kviews33comments
Save
VolumeMomentumEditor’s pick

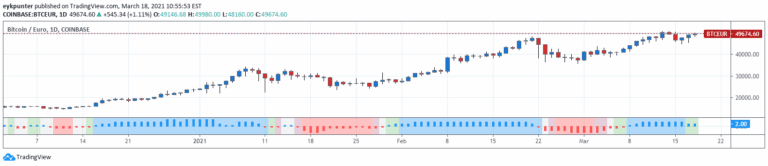
Faith Indicator

by eykpunter

A unique indicator that compares buyers' demand and sellers' supply volumes to assess market sentiment through a graded faith scale represented by colored histogram staves.

Separate pane · unverifiedDay Trading · Swing Trading
Explore
4Klikes53.3Kviews46comments
Save
LevelsVolatilityVolume

Liquidation Levels [LuxAlgo]

by LuxAlgo

A signal that identifies potential liquidation price levels where highly leveraged traders' positions may be forcibly closed, revealing key market support and resistance zones.

Main price chart · unverifiedScalping · Day Trading
Explore
4Klikes105.3Kviews18comments
Save
VolumeEditor’s pick

Volume Speed [By MUQWISHI]

by MUQWISHI

A dynamic volume analysis tool that tracks volume flow, measures trading activity intensity, and provides real-time insights into buyer and seller dominance across different timeframes.

Separate pane · unverifiedDay Trading · Swing Trading
Explore
1.9Klikes69.4Kviews40comments
Save
MomentumOscillatorTrend

Trend Strength | Flux Charts

by fluxchart

A comprehensive trend strength indicator combining RSI, Supertrend, and EMA Cross to provide dynamic trend detection and visualization with customizable settings.

Main price chart · unverifiedScalping · Day Trading
Explore
1.5Klikes24.4Kviews6comments
Save
LevelsTrend

Composite Scaled EMA Levels

by AhmetKasa

A composite EMA indicator that compares an asset's closing price with the XU100 index, scaling EMA values to provide unique market trend and support/resistance insights.

Main price chart · unverifiedDay Trading · Swing Trading
Explore
1.5Klikes13.3Kviews4comments
Save

Likes, views, and comments are historical TradingView snapshots. They describe attention, not trading performance.

START WITH A QUESTION

A little less searching.
A lot more understanding.

Tell DeepAlpha what you need. Get an explanation, a shortlist,
and a direct path to the indicators behind it.

Ask DeepAlpha