Quarterly Earnings
A TradingView script that displays quarterly earnings per share and sales data with year-on-year percentage changes, offering customizable visualization of financial performance metrics.
Explore 11,183 indicators. Filter beyond the obvious.
Discover the tools that fit the way you trade.
11,183 tools to explore
A TradingView script that displays quarterly earnings per share and sales data with year-on-year percentage changes, offering customizable visualization of financial performance metrics.
A volatility indicator using VIX to measure price deviation from VWAP, primarily designed for SPY. It calculates standard deviation moves based on implied volatility, helping traders understand potential price ranges.
The Diluted Earnings Per Share Signal (DEPSS) is a fundamental indicator that analyzes earnings surprises by comparing diluted EPS to analyst estimates to generate trading signals.
A comprehensive RSI heatmap screener that provides multi-asset market sentiment analysis through color-coded RSI visualization and detailed trading insights.
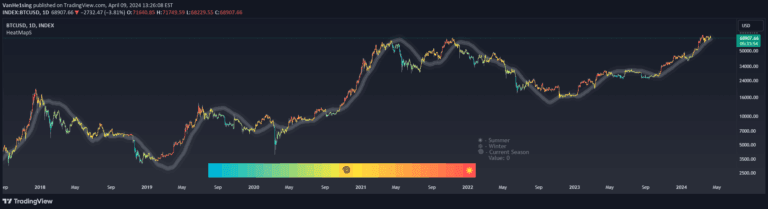
Heat Map Seasons indicator visualizes market dynamics through seasonal trends, using regression analysis and color-coded heat map to highlight market volatility and potential sentiment shifts.
An adaptive T3 moving average that dynamically adjusts its smoothing length using RSI, creating a responsive trend-following indicator that adapts to market volatility and momentum.
A comprehensive TradingView indicator for Bank Nifty index analysis using multiple technical indicators and advanced moving average techniques to generate trading signals.
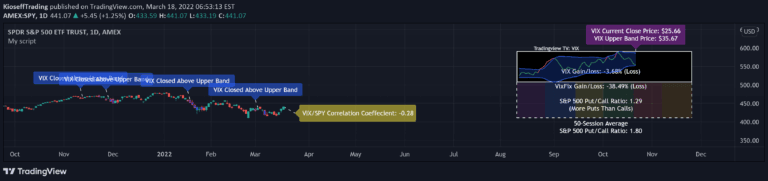
A VIX-based indicator that analyzes volatility correlation with asset prices, tracking VIX/VixFix movements and calculating potential market performance after specific volatility conditions.
Analyst Table provides comprehensive visual representation of analyst estimates and recommendations, displaying price targets and sentiment directly on the trading chart for quick market insights.
An advanced earnings analysis tool that calculates price performance before and after earnings releases, measuring potential correlations, price variations, and risk metrics for trading decisions.
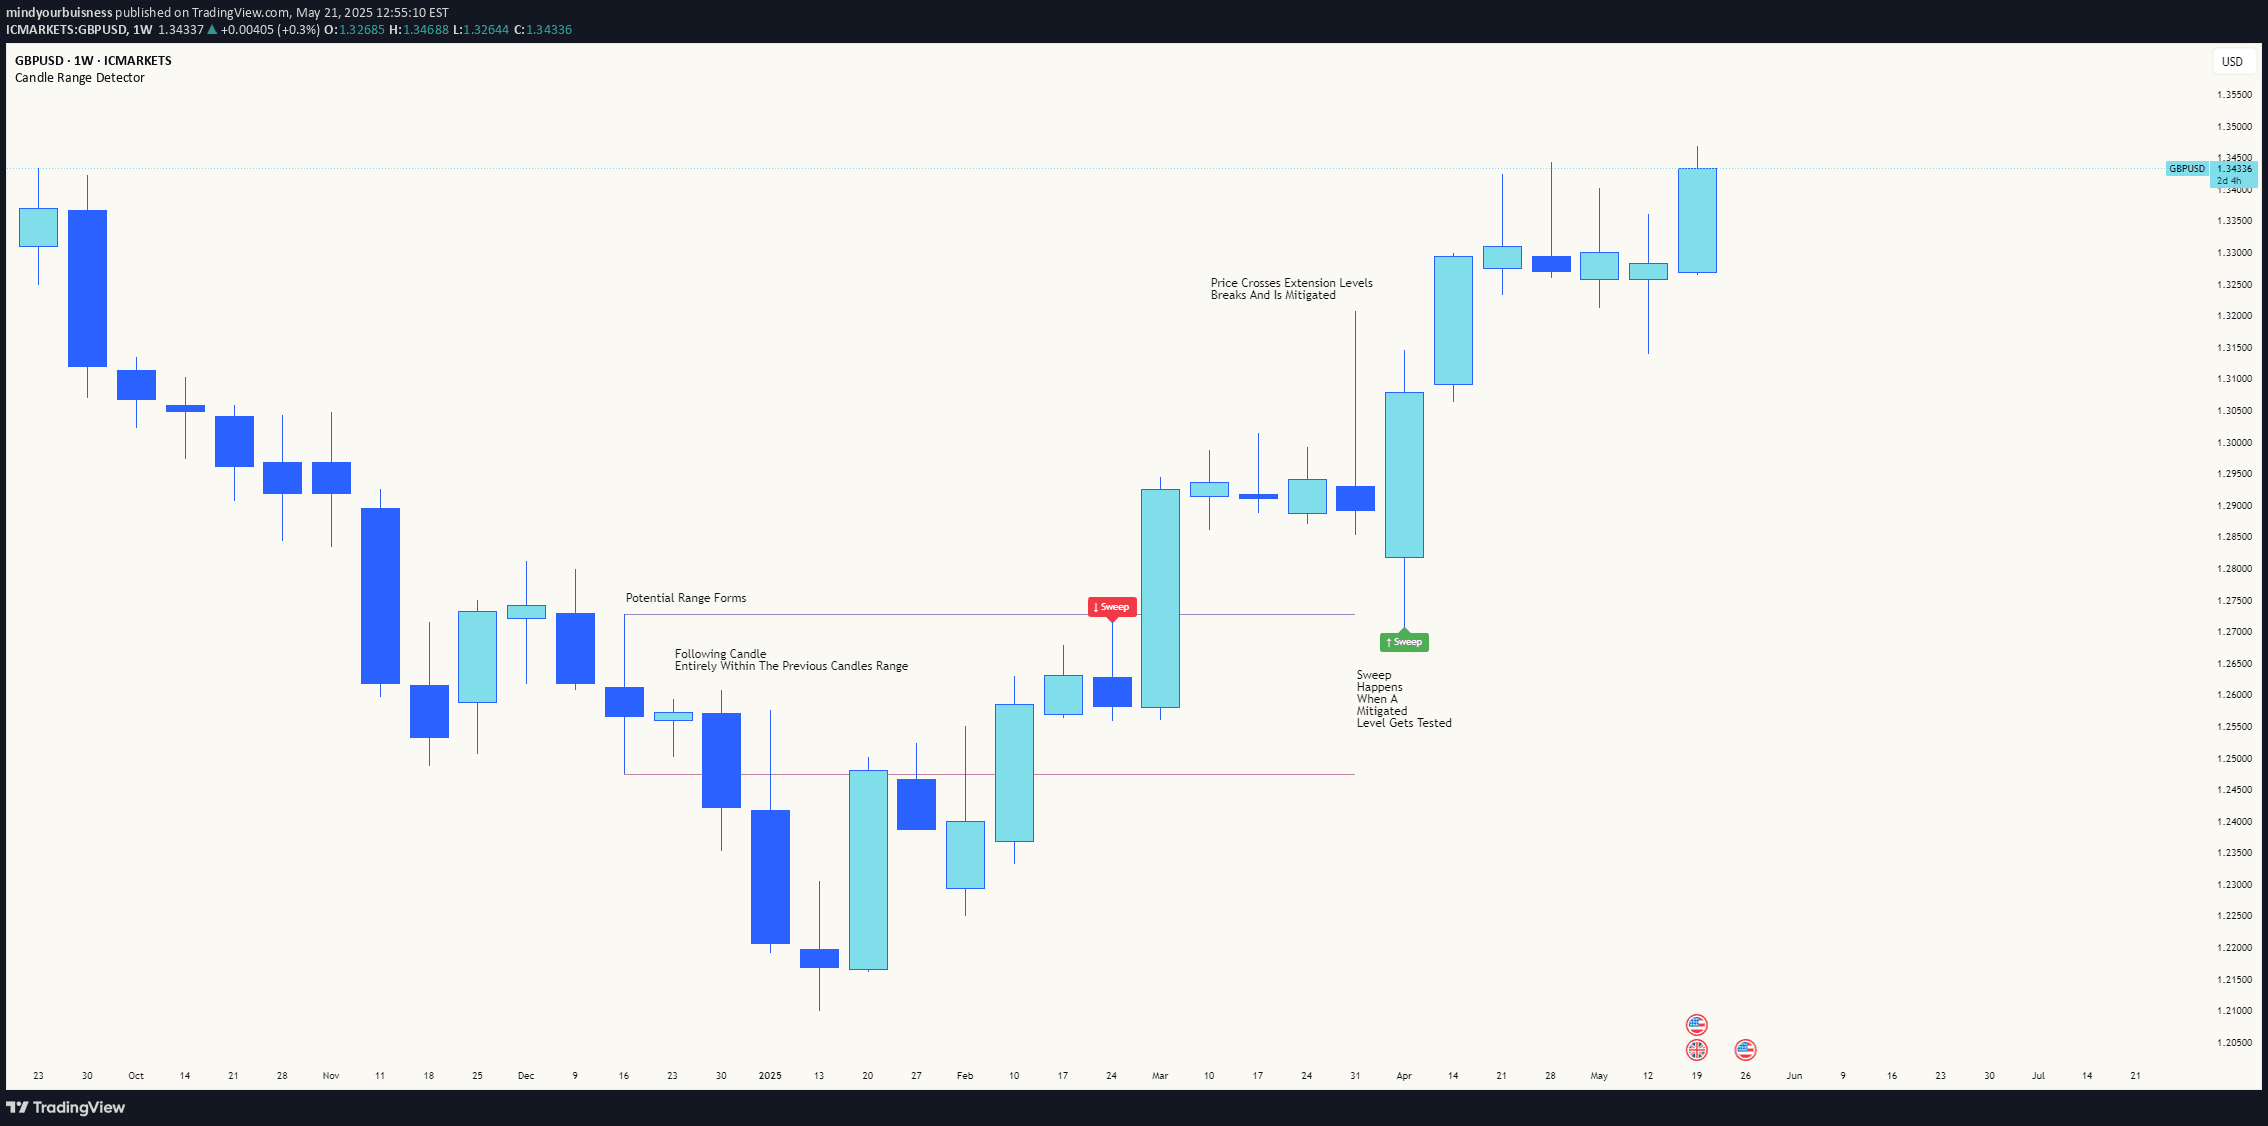
An advanced trading indicator that detects price ranges, tracks range mitigation, and identifies sweep events to highlight potential liquidity zones and market movement signals.
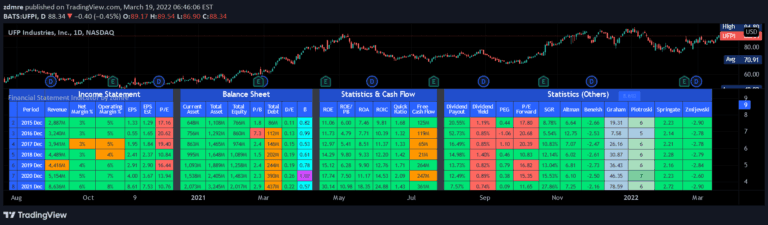
A comprehensive financial analysis tool that combines key financial statement metrics to assess a company's financial health, performance, and investment potential across income, balance sheet, and cash flow dimensions.
Likes, views, and comments are historical TradingView snapshots. They describe attention, not trading performance.