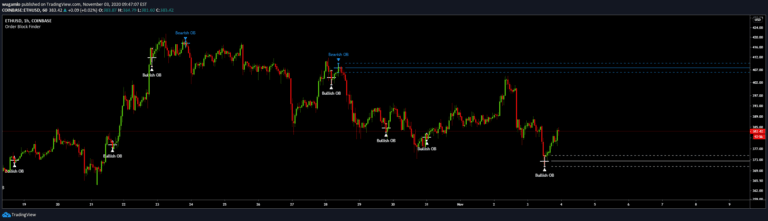
Order Block Finder (Experimental)
An indicator identifying institutional order blocks by detecting significant price zones where potential trend reversals or continuations might occur based on sequential candle patterns.
Explore 11,183 indicators. Filter beyond the obvious.
Discover the tools that fit the way you trade.
11,183 tools to explore
An indicator identifying institutional order blocks by detecting significant price zones where potential trend reversals or continuations might occur based on sequential candle patterns.
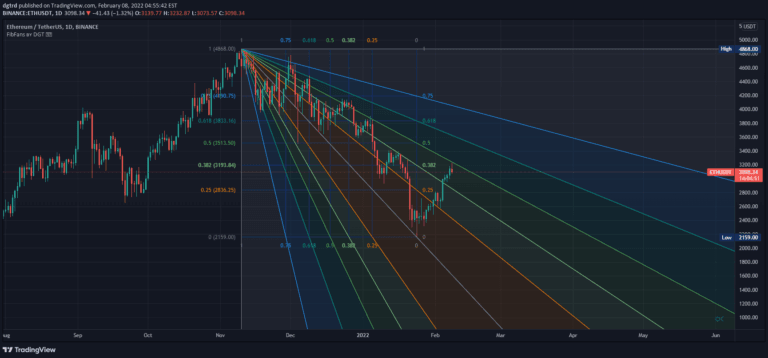
Fibonacci Speed and Resistance Fan is an analytical tool that identifies potential support and resistance levels by drawing lines based on Fibonacci percentages to predict trend changes and market movements.
A psychological support/resistance indicator that identifies potential price reaction zones based on sequential candle movements and provides hypothetical support and resistance levels.
A market structure indicator that identifies price action trends by analyzing bullish and bearish candle sequences, providing insights into potential directional changes and trading opportunities.
A trend-following system that uses volatility-scaled steps to track market momentum, visualizing trend progression through discrete channels and adaptive volatility bands.
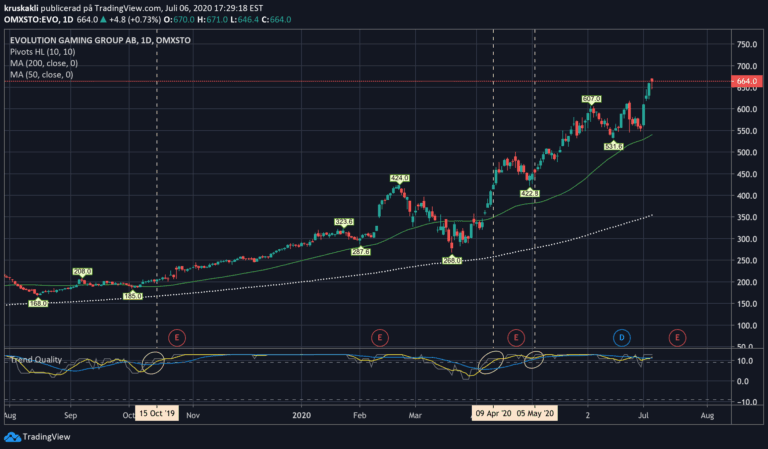
A trend quality indicator that evaluates market momentum by scoring multiple moving averages and their sequential hierarchy to determine trend strength and potential trading opportunities.
The Kalman Price Filter is an advanced algorithmic tool that smooths financial data, helping traders identify true market trends by filtering out noise and adaptively tracking price movements.
Pivot points are unique pattern recognition techniques for identifying market structure through sequential high and low formations across different bar configurations and complexity levels.
The Sequencer is an advanced indicator that identifies potential price reversals by tracking sequential price movements across two customizable phases: preparation and lead-up.
A multiple information panel using tables provides traders with comprehensive visual data representations across various trading metrics, enabling quick and efficient analysis of complex market information.
A technical indicator that detects potential price turning points using dual moving average analysis, bar coloring, and sequential setup and countdown patterns for identifying trend reversals.
A Fibonacci-based timing pattern that identifies potential medium-term price reversals by analyzing sequential close prices across multiple historical periods.
Likes, views, and comments are historical TradingView snapshots. They describe attention, not trading performance.