Candle Range Theory | Flux Charts
A unique trading indicator using Candle Range Theory to analyze market movements through candlestick size and structure, offering flexible entry methods with dynamic risk management.
Explore 11,183 indicators. Filter beyond the obvious.
Discover the tools that fit the way you trade.
11,183 tools to explore
A unique trading indicator using Candle Range Theory to analyze market movements through candlestick size and structure, offering flexible entry methods with dynamic risk management.
A multi-ticker dashboard that visually tracks swing structures across different timeframes, helping traders identify potential trend formations and market confluence.
A custom Tradingview indicator designed to display chart information cleanly while providing a personalized watermark for traders seeking discipline and self-mastery.
A Pine Script technique for combining multiple cryptocurrency price data into a single composite ticker using advanced request.security() method, enabling efficient multi-ticker analysis.
A machine learning tool that groups tickers with similar correlation coefficients to help traders analyze asset relationships and optimize trading strategies.
A Pine Script v5 indicator that creates a customizable watermark on TradingView charts, displaying key stock information with flexible positioning and formatting options.
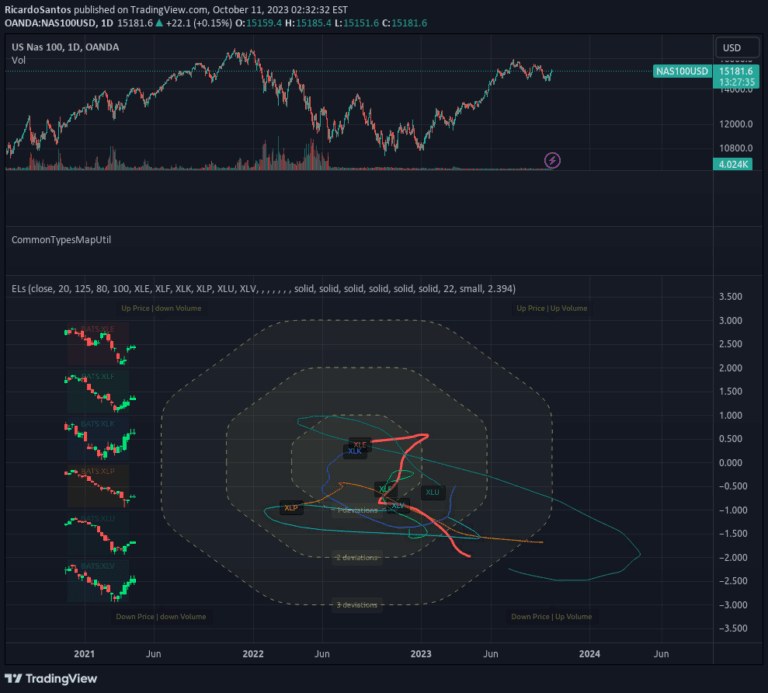
An expanded crocker graph visualization technique that tracks multiple tickers simultaneously, providing a comprehensive market overview with embedded commodity candle details.
Option Volume indicator tracks and visualizes volume activity for up to 10 custom option strike symbols, offering individual and cumulative volume display modes for real-time option flow analysis.
A multi-length RSI screener that analyzes up to 240 tickers simultaneously, tracking RSI overbought and oversold conditions across different periods.
PSP is a technical analysis tool comparing price action across three tickers to identify market desynchronization and potential trading opportunities based on price structure divergences.
SuperTrend MTF Pro is an advanced, customizable trend indicator that provides dynamic market direction signals using multiple moving average types and chart formats.
A dynamic ticker tape that displays real-time price updates and daily changes for multiple securities, scrolling horizontally across the chart bottom for instant market insights.
Likes, views, and comments are historical TradingView snapshots. They describe attention, not trading performance.