YOUR INDICATOR RESEARCH STARTS HERE

Find the right indicator.
Understand what it does.

Explore 11,183 indicators. Filter beyond the obvious.
Discover the tools that fit the way you trade.

THE INDICATOR LIBRARY

Results for “Market Geometry”

11,183 tools to explore

26 indicators matching your filters
Save search
TrendMomentumEditor’s pick

Fibonacci Time-Price Zones

by xxattaxx

Fibonacci Time-Price Zones is an advanced indicator that combines Fibonacci ratios with time and price analysis, offering multiple geometric visualization methods to identify market turning points.

Main price chart · unverifiedDay Trading · Swing Trading
Explore
5.2Klikes147.5Kviews33comments
Save
TrendMomentumEditor’s pick

Gann Box (Zeiierman)

by Zeiierman

The Gann Box is a technical analysis tool that uses geometric principles to identify potential support and resistance levels, forecast price movements, and analyze market trends.

Main price chart · unverifiedDay Trading · Swing Trading
Explore
3Klikes97.3Kviews58comments
Save
LevelsSignal

ICT Daily Levels and Zones (fadi)

by fadizeidan

ICT Daily Levels and Zones indicator automatically highlights key trading levels and zones for ICT-style traders, providing essential market context and timing insights.

Main price chart · unverifiedScalping · Day Trading
Explore
1.3Klikes35.7Kviews41comments
Save
VolumeEditor’s pick

Equivolume Bars

by rumpypumpydumpy

Equivolume bars create charts where bar width dynamically represents trading volume, providing visual insights into market activity independent of traditional time scales.

Main price chart · unverifiedDay Trading · Swing Trading
Explore
821likes17.4Kviews23comments
Save
TrendEditor’s pick

chartpatterns

by Trendoscope

A chart pattern library that identifies and visualizes specific trading patterns using zigzag pivot points, helping traders detect and analyze complex market structures.

Main price chart · unverifiedSwing Trading
Explore
432likes15.4Kviews15comments
Save
TrendMomentum

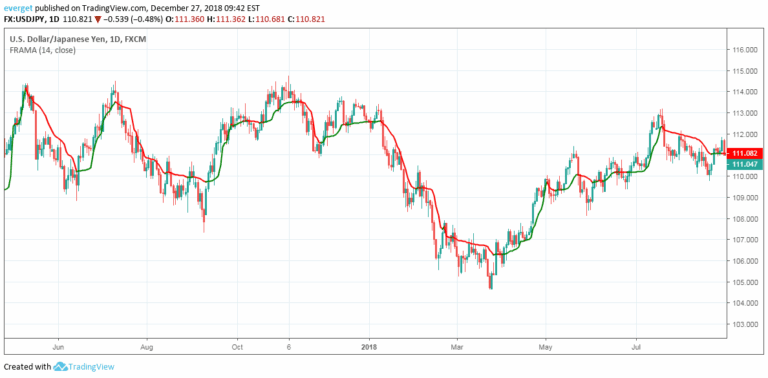
Fractal Adaptive Moving Average

by everget

Fractal Adaptive Moving Average is a dynamic indicator that adjusts its calculation based on market volatility, providing flexible trend analysis and smoothing price movements.

Main price chart · unverifiedDay Trading · Swing Trading
Explore
365likes7.5Kviews0comments
Save
LevelsSignalTrend

Fibonacci 3-D

by xxattaxx

A multi-dimensional Fibonacci tool that uses three points to create advanced projections, offering dynamic support and resistance analysis beyond traditional methods.

Main price chart · unverifiedScalping · Day Trading
Explore
333likes4.5Kviews3comments
Save
TrendVolatilityEditor’s pick

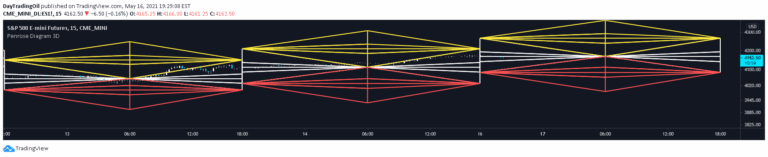
Penrose Diagram

by DrCatherineHalsey

A unique trading visualization technique that maps price movements using Penrose diagrams, transforming complex market data into a spatial representation of potential trading scenarios.

Main price chart · unverifiedDay Trading · Swing Trading
Explore
239likes10Kviews12comments
Save
TrendMomentum

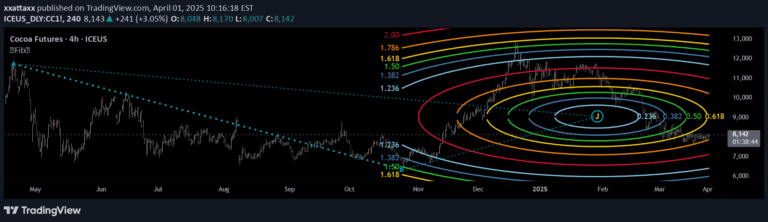
Fibonacci Circle Zones

by xxattaxx

Fibonacci Circle Zones is a technical visualization tool that uses geometric circles to analyze price-time relationships, projecting potential support and resistance zones using advanced mathematical formulas.

Main price chart · unverifiedSwing Trading
Explore
185likes2.7Kviews1comments
Save

Likes, views, and comments are historical TradingView snapshots. They describe attention, not trading performance.

START WITH A QUESTION

A little less searching.
A lot more understanding.

Tell DeepAlpha what you need. Get an explanation, a shortlist,
and a direct path to the indicators behind it.

Ask DeepAlpha