Relative Strength(RSMK) + Perks - Markos Katsanos
A novel Relative Strength indicator that compares an asset's performance against market indices like S&P 500, Dow Jones, and NASDAQ to provide comparative market insights.
Explore 11,183 indicators. Filter beyond the obvious.
Discover the tools that fit the way you trade.
11,183 tools to explore
A novel Relative Strength indicator that compares an asset's performance against market indices like S&P 500, Dow Jones, and NASDAQ to provide comparative market insights.
Money Flow Divergence indicator analyzes the relationship between S&P 500 index growth and U.S. M2 money supply to identify potential market turning points and liquidity trends.
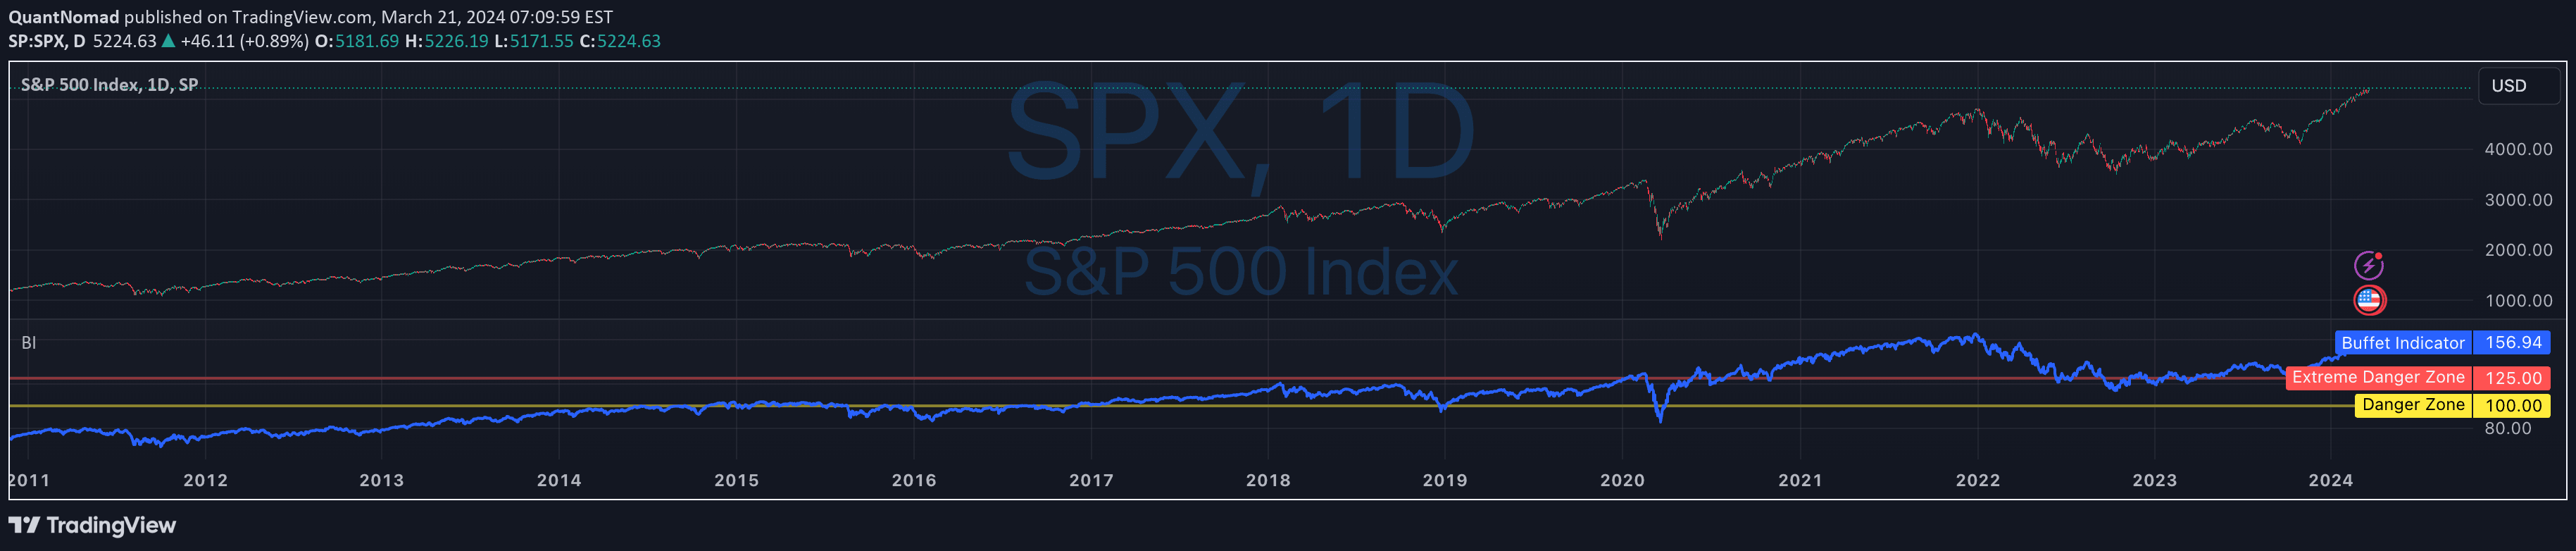
A market valuation indicator comparing total stock market capitalization to US GDP, providing insight into potential market overvaluation or undervaluation.
A trading strategy identifying potential long entries by detecting price action scenarios where an initial low is undercut and then reclaimed with specific momentum conditions.
A comprehensive financial ratio indicator for the S&P 500 that provides detailed insights into market valuation, earnings, and performance using multiple financial metrics.
A VIX-based trading signal that analyzes market sentiment by measuring volatility, correlations between VIX, S&P 500, and a specific stock to predict potential price movements.
A minimalist ICT-style trading indicator that detects potential market reversals by identifying liquidity sweeps and displacement patterns in specific time windows.
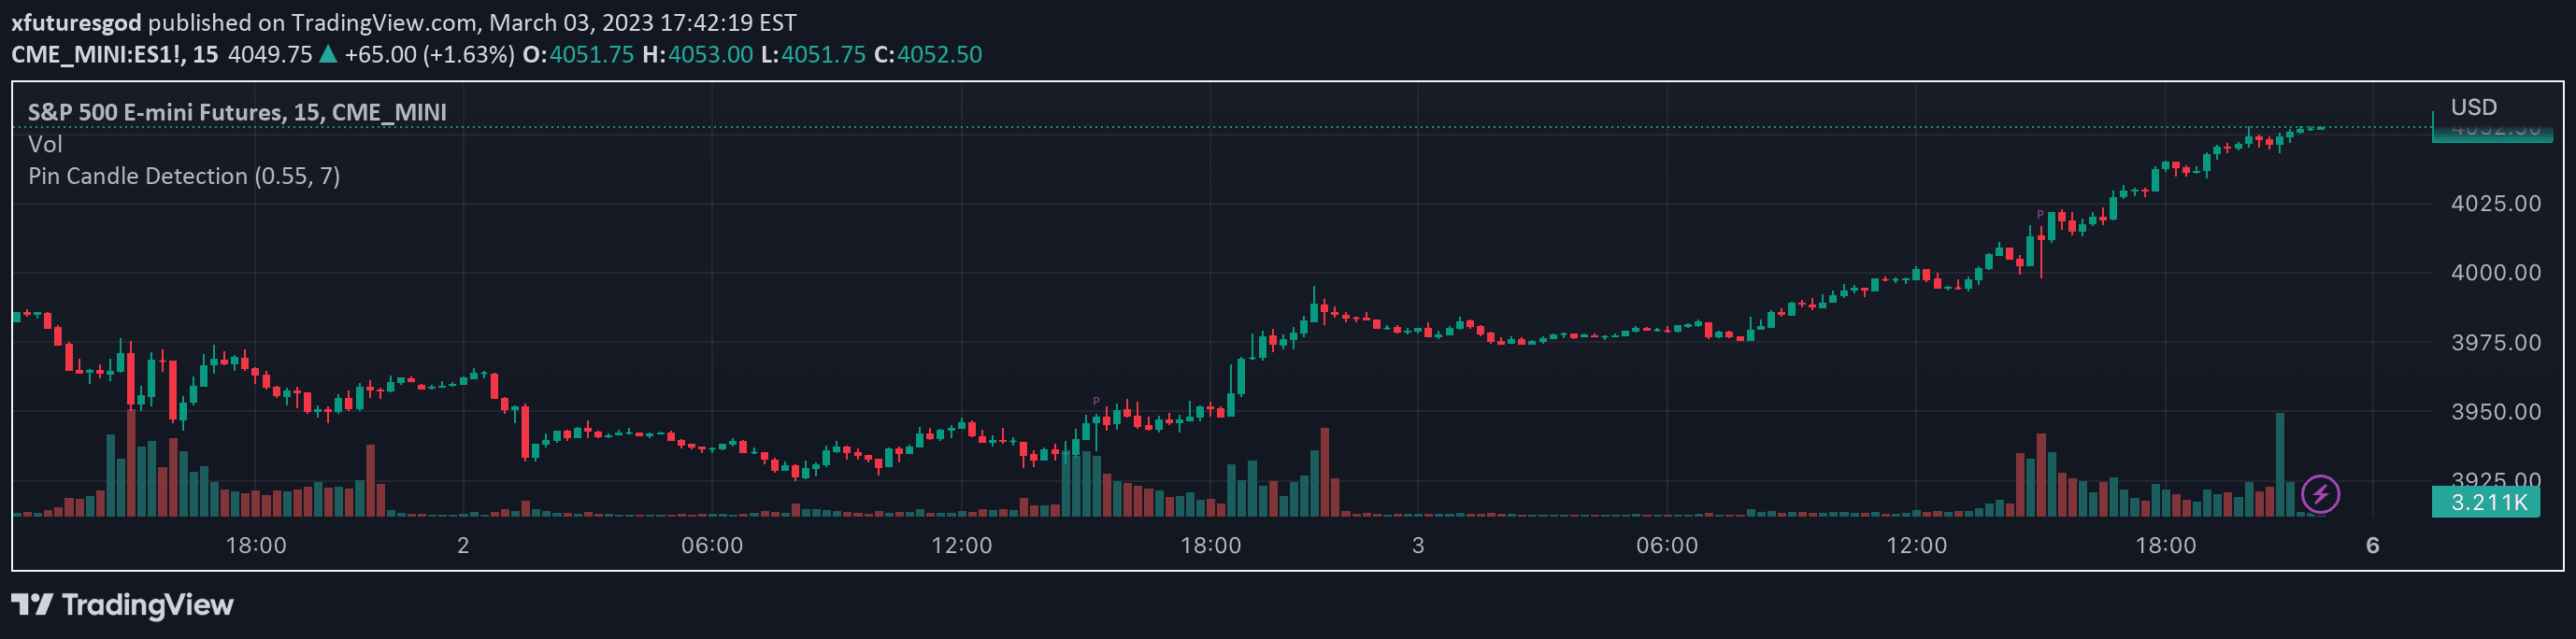
Pin candles are technical analysis indicators tracking specific candle formations with significant wick lengths for potential market entry points, particularly useful in futures trading.
A statistical test that determines whether a time series is stationary or non-stationary, helping traders understand if a financial instrument tends to mean-revert or follow a trend.
An innovative indicator tracking S&P 500 industry sectors' performance relative to their 200-period highs and lows, offering insight into market cycle stages.
A trading indicator comparing prices of S&P 500, Tesla, and Bitcoin to identify potential correlations and trading opportunities by calculating and overlaying adjusted asset prices.
A script analyzing percentage distances of 11 S&P 500 sector indices from their moving averages, helping traders identify potential mean reversion and sector-specific extremes.
Likes, views, and comments are historical TradingView snapshots. They describe attention, not trading performance.