YOUR INDICATOR RESEARCH STARTS HERE

Find the right indicator.
Understand what it does.

Explore 11,183 indicators. Filter beyond the obvious.
Discover the tools that fit the way you trade.

THE INDICATOR LIBRARY

Results for “efficient”

11,183 tools to explore

72 indicators matching your filters
Save search
PatternsSignalTrend

Algo Market Structure (Nephew_Sam_)

by nephew_sam_

A market structure indicator that identifies price action trends by analyzing bullish and bearish candle sequences, providing insights into potential directional changes and trading opportunities.

Main price chart · unverifiedScalping · Day Trading
Explore
2.8Klikes68Kviews20comments
Save
TrendEditor’s pick

120x ticker screener (composite tickers)

by fikira

A Pine Script technique for combining multiple cryptocurrency price data into a single composite ticker using advanced request.security() method, enabling efficient multi-ticker analysis.

Main price chart · unverifiedDay Trading · Swing Trading
Explore
1.2Klikes55.8Kviews80comments
Save
TrendMomentumEditor’s pick

Efficient Work [LucF]

by LucF

Efficient Work measures price movement efficiency by comparing price travel distance to actual price change, providing insights into market sentiment and price movement strength.

Separate pane · unverifiedDay Trading · Swing Trading
Explore
1.1Klikes20.6Kviews17comments
Save
TrendEditor’s pick

TA Information Panel

by RicardoSantos

A multiple information panel using tables provides traders with comprehensive visual data representations across various trading metrics, enabling quick and efficient analysis of complex market information.

Separate pane · unverifiedDay Trading · Swing Trading
Explore
1.1Klikes27.2Kviews8comments
Save
TrendMomentumEditor’s pick

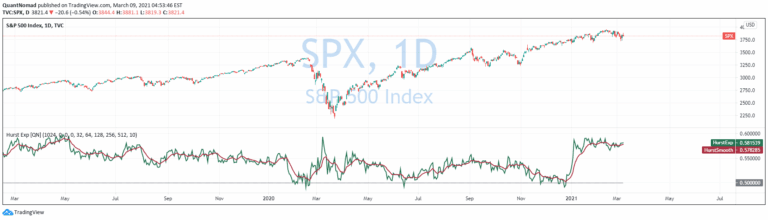
Hurst Exponent

by QuantNomad

The Hurst Exponent is a statistical measure that evaluates time series behavior, helping traders identify market trends, mean reversion, and potential future price movements.

Separate pane · unverifiedDay Trading · Swing Trading
Explore
861likes26.4Kviews10comments
Save
SignalTrend

Historical Correlation [LuxAlgo]

by LuxAlgo

Historical Correlation tool calculates correlation coefficients between assets, revealing how different financial instruments move in relation to each other over time.

Separate pane · unverifiedScalping · Day Trading
Explore
693likes20.6Kviews4comments
Save
TrendVolatilityEditor’s pick

Correlation Heatmap

by TradingView

A correlation matrix indicator that calculates Pearson correlation coefficients between multiple financial instruments, revealing how different assets' returns move in relation to each other.

Separate pane · unverifiedSwing Trading
Explore
622likes22.8Kviews10comments
Save
TrendMomentumEditor’s pick

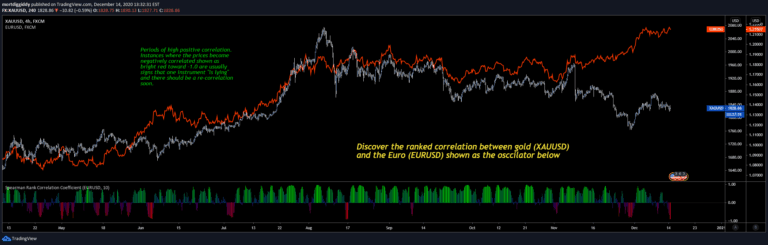
Spearman Rank Correlation Coefficient

by mortdiggiddy

Spearman rank correlation coefficient measures the relationship between two variables by analyzing how they increase or decrease together, revealing potential market synchronization patterns.

Separate pane · unverifiedSwing Trading
Explore
619likes17.1Kviews28comments
Save

Likes, views, and comments are historical TradingView snapshots. They describe attention, not trading performance.

START WITH A QUESTION

A little less searching.
A lot more understanding.

Tell DeepAlpha what you need. Get an explanation, a shortlist,
and a direct path to the indicators behind it.

Ask DeepAlpha