Anti-Volume Stop Loss
An advanced stop-loss strategy that uses volume, price, and volatility to dynamically adjust stop-loss levels, helping traders manage risk by considering individual security characteristics.
Explore 11,183 indicators. Filter beyond the obvious.
Discover the tools that fit the way you trade.
11,183 tools to explore
An advanced stop-loss strategy that uses volume, price, and volatility to dynamically adjust stop-loss levels, helping traders manage risk by considering individual security characteristics.
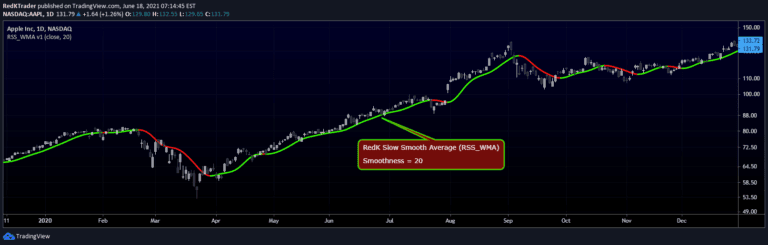
RedK Slow Smooth Average (RSS_WMA) is a specialized moving average designed to provide smooth trend visualization by filtering out short-term price noise through multiple weighted moving average passes.
A TradingView script that displays quarterly earnings per share and sales data with year-on-year percentage changes, offering customizable visualization of financial performance metrics.
The RS Rating evaluates a stock's price performance relative to the market over 52 weeks, helping traders identify stocks that are outperforming and potentially poised for further gains.
Flag Finder is a technical analysis tool that identifies bullish and bearish flag patterns, helping traders detect potential price continuation signals during market trends.
The Ehlers Loops indicator reveals price and volume dynamics through a quadrant-based visual representation, helping traders understand market momentum and potential trend reversals.
A pivot-based liquidity indicator that identifies and tracks significant price levels with expanding channels, helping traders visualize potential order zones and liquidity areas.
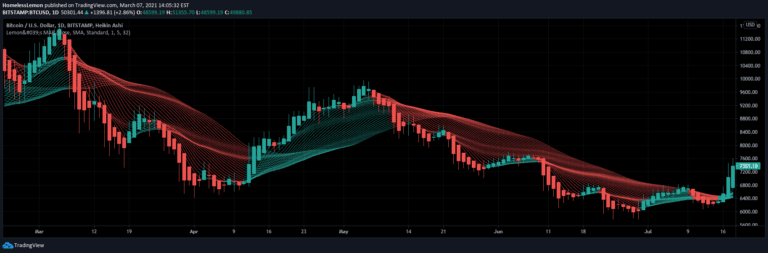
A customizable moving average ribbon indicator that helps traders analyze trend strength and direction by plotting multiple moving averages with adjustable parameters and visual themes.
A script for quickly analyzing trading signals by computing performance metrics across different stop-loss and take-profit configurations using SuperTrend signals.
A DSL Trend Analysis indicator that tracks price momentum using dynamic signal lines and bands, providing visual insights into trend strength and potential market shifts.
A sophisticated technical analysis tool combining RSI, Discontinued Signal Lines, and ZLEMA to identify market trends, momentum, and potential reversals with adaptive signal generation.
A trading strategy implementing dynamic trailing stop-loss and target mechanisms using percentage or fixed point-based calculations to manage trade entries and exits.
Likes, views, and comments are historical TradingView snapshots. They describe attention, not trading performance.