Multi-Asset Performance [Spaghetti] - By Leviathan
A multi-asset performance indicator that tracks percentage changes across 30 symbols, offering comprehensive insights into asset performance, correlation, and market dynamics.
Explore 11,183 indicators. Filter beyond the obvious.
Discover the tools that fit the way you trade.
11,183 tools to explore
A multi-asset performance indicator that tracks percentage changes across 30 symbols, offering comprehensive insights into asset performance, correlation, and market dynamics.
A trading tool that identifies top-performing stocks within specific industry groups by analyzing performance metrics like YTD return and relative strength.
The Double Ribbon indicator combines two Simple Moving Average ribbons to assess market trends and momentum, providing a visual and quantitative analysis of market direction and strength.
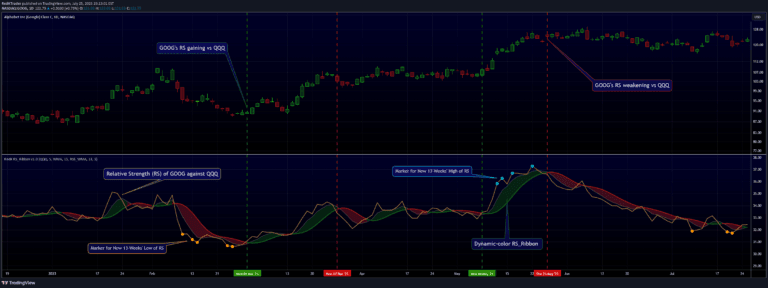
A novel Relative Strength indicator that compares an asset's performance against market indices like S&P 500, Dow Jones, and NASDAQ to provide comparative market insights.
A machine learning tool that groups tickers with similar correlation coefficients to help traders analyze asset relationships and optimize trading strategies.
A technical analysis tool that compares a stock's performance against a benchmark index, revealing relative strength and potential market leadership through comprehensive RS calculation and visualization.
Market breadth is an analytical tool that evaluates the number of stocks advancing or declining in an index, providing insights into overall market strength and potential trend reversals.
The Dynamic Factor Supertrend is an advanced trend-following indicator that adapts to market conditions by dynamically adjusting its trend line based on price movements and volatility.
A technical chart pattern that identifies increasing market volatility through expanding price ranges, creating higher highs and lower lows using pivot point analysis.
The Bolton-Tremblay Index analyzes market trends by tracking advancing, declining, and unchanged securities to provide a comprehensive view of market dynamics and sentiment.
An indicator tracking All-Time High (ATH) and All-Time Low (ATL) changes, providing insights into market sentiment and breadth by analyzing price movements across historical peaks and troughs.
A relative strength indicator that compares a stock's performance against the S&P 500 using low prices and exponential moving averages to identify momentum shifts.
Likes, views, and comments are historical TradingView snapshots. They describe attention, not trading performance.