Currency Strength [LuxAlgo]
A currency strength indicator that measures relative performance of currencies by comparing their exchange rates and tracking their strength over time using a specialized meter and scatter plot.
Explore 11,183 indicators. Filter beyond the obvious.
Discover the tools that fit the way you trade.
11,183 tools to explore
A currency strength indicator that measures relative performance of currencies by comparing their exchange rates and tracking their strength over time using a specialized meter and scatter plot.
A relative strength indicator comparing a stock's performance to an index by measuring the distance from moving averages, providing insights into comparative market behavior.
Relative Volume indicator measures trading volume compared to historical averages, helping traders identify significant market activity and potential trading opportunities across different timeframes.
A novel Relative Strength indicator that compares an asset's performance against market indices like S&P 500, Dow Jones, and NASDAQ to provide comparative market insights.
A volatility-adjusted relative strength indicator that compares a stock's performance to a benchmark index by normalizing price movements using Average True Range.
A custom trading tool that compares relative strength between two financial symbols by creating a comparative chart, helping traders identify stronger market relationships and potential trading opportunities.
Market Smith's advanced charting tool providing comprehensive stock analysis through moving averages, pivot points, relative strength line, and rating to evaluate stock performance.
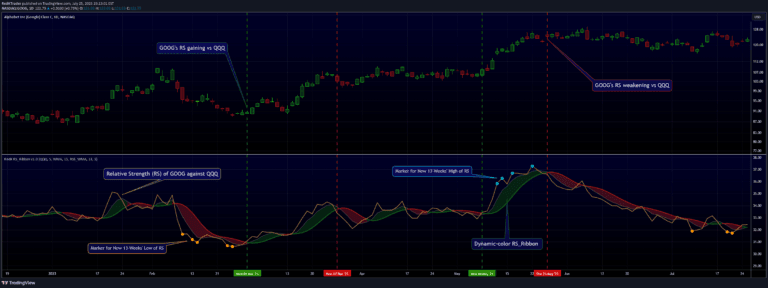
A technical analysis tool that compares a stock's performance against a benchmark index, revealing relative strength and potential market leadership through comprehensive RS calculation and visualization.
A Pine Script indicator that calculates and visualizes percent rank for multiple financial instruments, helping traders quickly assess relative performance across different assets.
A weekly RSI indicator that identifies potential buy and sell opportunities by tracking momentum through oversold and overbought levels on the 14-period RSI.
An RSI-based trading signal that detects correlated market movements and generates potential trading indicators across different timeframes and securities.
A custom relative strength indicator that measures a stock's performance against market benchmarks by comparing rate of change and normalized Average True Range.
Likes, views, and comments are historical TradingView snapshots. They describe attention, not trading performance.