MARS - Moving Average Relative Strength
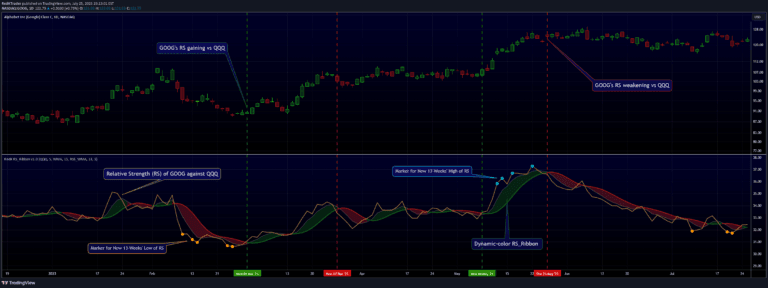
A relative strength indicator comparing a stock's performance to an index by measuring the distance from moving averages, providing insights into comparative market behavior.
Explore 11,183 indicators. Filter beyond the obvious.
Discover the tools that fit the way you trade.
11,183 tools to explore
A relative strength indicator comparing a stock's performance to an index by measuring the distance from moving averages, providing insights into comparative market behavior.
A composite EMA indicator that compares an asset's closing price with the XU100 index, scaling EMA values to provide unique market trend and support/resistance insights.
An indicator that estimates contract liquidation prices by analyzing abnormal changes in open interest and generating liquidation lines across different leverage levels.
A comprehensive trading script enabling portfolio management and performance analysis with customizable settings for instrument selection, capital allocation, and benchmark comparison.
Minervini Qualifier is a stock screening indicator that evaluates price momentum, trend strength, and relative performance against a benchmark index.
A novel Relative Strength indicator that compares an asset's performance against market indices like S&P 500, Dow Jones, and NASDAQ to provide comparative market insights.
BooBee Digital provides precise buy and sell trading signals by integrating Average True Range trailing stops, Volume Weighted Average Price, and EMA crossover to help traders navigate market volatility and volume.
A volatility-adjusted relative strength indicator that compares a stock's performance to a benchmark index by normalizing price movements using Average True Range.
Market Smith's advanced charting tool providing comprehensive stock analysis through moving averages, pivot points, relative strength line, and rating to evaluate stock performance.
A technical analysis tool that compares a stock's performance against a benchmark index, revealing relative strength and potential market leadership through comprehensive RS calculation and visualization.
A comprehensive risk analysis tool that calculates Sharpe and Sortino ratios to evaluate investment performance relative to risk, helping traders assess the efficiency of their trading strategies.
Relative strength measures a stock's price performance compared to a market index, revealing how an asset performs relative to a benchmark over a specific time period.
Likes, views, and comments are historical TradingView snapshots. They describe attention, not trading performance.