YOUR INDICATOR RESEARCH STARTS HERE

Find the right indicator.
Understand what it does.

Explore 11,183 indicators. Filter beyond the obvious.
Discover the tools that fit the way you trade.

THE INDICATOR LIBRARY

Results for “sample”

11,183 tools to explore

34 indicators matching your filters
Save search
VolumeTrendEditor’s pick

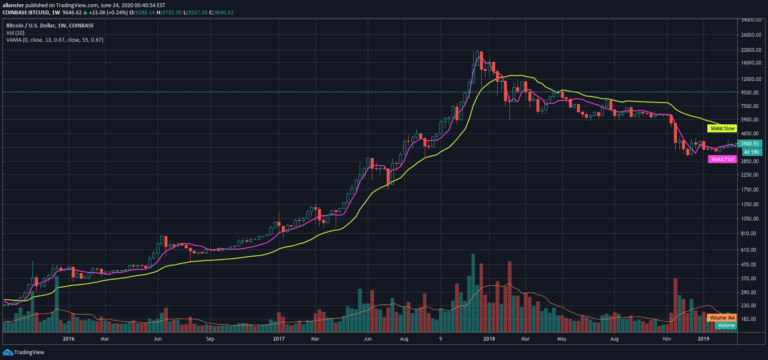
VAMA Volume Adjusted Moving Average Function

by allanster

Volume Adjusted Moving Average (VAMA) is an advanced indicator that calculates moving averages based on volume increments rather than traditional time-based methods, offering a unique perspective on price trends.

Main price chart · unverifiedDay Trading · Swing Trading
Explore
2.8Klikes64.8Kviews36comments
Save
TrendVolatilityEditor’s pick

Resampling Filter Pack [DW]

by DonovanWall

A flexible price filtering tool that resamples and analyzes market data using multiple methods and advanced moving average techniques to reduce noise and identify underlying price trends.

Main price chart · unverifiedDay Trading · Swing Trading
Explore
1.9Klikes28.6Kviews32comments
Save
TrendMomentumEditor’s pick

Tops & Bottoms - Time of Day Report

by sbtnc

A trading indicator that tracks and reports the percentage of daily market tops and bottoms by time of day, helping traders understand market reversal patterns and optimal entry/exit points.

Separate pane · unverifiedDay Trading · Swing Trading
Explore
1.1Klikes77.6Kviews22comments
Save
TrendMomentumEditor’s pick

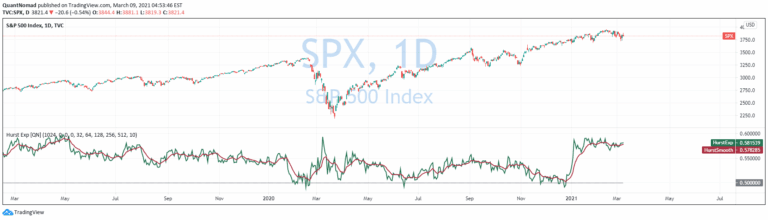
Hurst Exponent

by QuantNomad

The Hurst Exponent is a statistical measure that evaluates time series behavior, helping traders identify market trends, mean reversion, and potential future price movements.

Separate pane · unverifiedDay Trading · Swing Trading
Explore
861likes26.4Kviews10comments
Save
MomentumVolatilityEditor’s pick

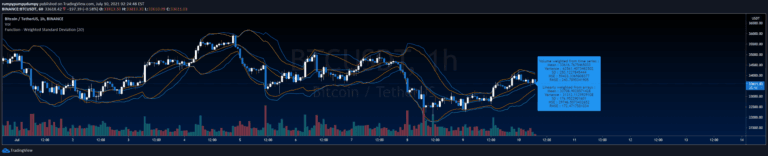
Function - Weighted Standard Deviation

by rumpypumpydumpy

A statistical analysis function that calculates weighted mean, variance, standard deviation, and error metrics for time series data, helping traders understand data distribution and variability.

Separate pane · unverifiedDay Trading · Swing Trading
Explore
502likes18.6Kviews7comments
Save
TrendVolatilityEditor’s pick

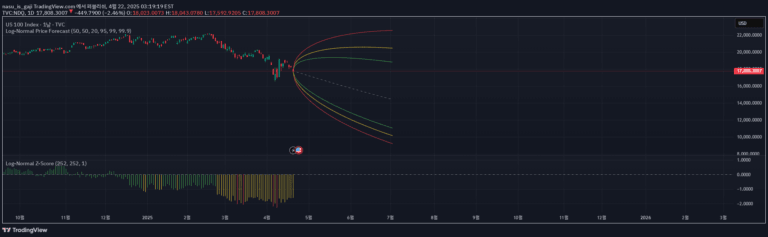
Log-Normal Price Forecast

by nasu_is_gaji

A log-normal price forecast model that predicts future price trajectories using historical log returns, creating statistical projections with confidence intervals and volatility analysis.

Main price chart · unverifiedDay Trading · Swing Trading
Explore
357likes13.1Kviews6comments
Save
TrendVolatility

[COG]Adaptive Volatility Bands

by CognitiveAlpha

The Adaptive Volatility Bands (AVB) is a dynamic technical analysis tool that creates responsive price channels, helping traders understand market conditions by adjusting to changing volatility in real-time.

Main price chart · unverifiedDay Trading · Swing Trading
Explore
324likes3.5Kviews3comments
Save
MomentumSignalTrend

PA-Adaptive T3 Loxxer [Loxx]

by loxx

PA-Adaptive T3 Loxxer is a technical analysis tool that uses phase accumulation and T3 moving average to measure asset demand and generate smoother trading signals.

Separate pane · unverifiedScalping · Day Trading
Explore
309likes7.8Kviews3comments
Save

Likes, views, and comments are historical TradingView snapshots. They describe attention, not trading performance.

START WITH A QUESTION

A little less searching.
A lot more understanding.

Tell DeepAlpha what you need. Get an explanation, a shortlist,
and a direct path to the indicators behind it.

Ask DeepAlpha